6
$\begingroup$

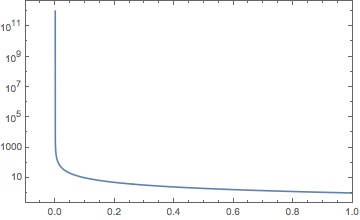
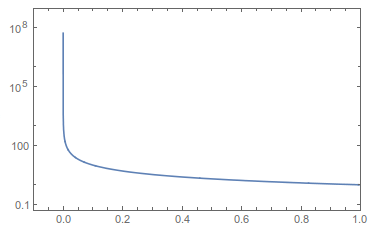
LogPlot ignores points which are going to "too high" values:

LogPlot[1/x, {x, 10^-12, 1}, PlotRange -> {{-.1, 1}, All},Frame -> True]

gives:

enter image description here

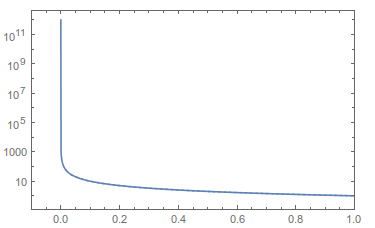
I'd rather expect to see:

enter image description here

which was done by use of

ListLogPlot[{#, 1/#} & /@ Range[10^-12, 1, .001],
            PlotRange -> {{-.1, 1}, All}, Joined -> True, Frame -> True]

How to force LogPlot to see ALL points, especially those at the boundary of arguments?

$\endgroup$
8
  • 2
    $\begingroup$ You can try PlotRange -> {{-.1, 1}, {0, 10^12}} or so. $\endgroup$ Commented Jul 7, 2015 at 11:11
  • $\begingroup$ The problem is not caused by an improper PlotRange or ignoring "points which are going to "too high" ". The reason why there are no higher values shown is that the first x-value at which the function 1/x is evaluated is Cases[LogPlot[1/x, {x, 10^-12, 1}, PlotRange -> {{-.1, 1}, All}, Frame -> True], Line[x_] :> x[[1, 1]], Infinity] => {2.04092*10^-8}. $\endgroup$
    – Karsten7
    Commented Jul 7, 2015 at 13:21
  • $\begingroup$ Increasing the number of PlotPoints helps, but doesn't solve the problem completely. $\endgroup$
    – Karsten7
    Commented Jul 7, 2015 at 13:22
  • 1
    $\begingroup$ @b.gatessucks - it does not work, or even worse, I checked it before posting $\endgroup$
    – sebqas
    Commented Jul 8, 2015 at 17:20
  • 1
    $\begingroup$ @Karsten 7 - that I also have been trying, even with PlotPoints->100 000, I still cant get the proper value at the peak. $\endgroup$
    – sebqas
    Commented Jul 8, 2015 at 17:24

4 Answers 4

9
$\begingroup$

The fact that your plot doesn't show "too high" values isn't specific to LogPlot, has nothing to do with the PlotRange you specified, and also isn't due to the values being "too high". It is the result of the initial sampling of the plot points. According to my observations so far, no Plot includes the lower and upper limit specified for the variable. For example Plot[f, {x, xmin, xmax} plots f for xmin < x < xmax and not for xmin <= x <= xmax, meaning f is plotted for the open interval $(xmin, xmax)$ and not for $[xmin, xmax]$.

First, one way to make your LogPlot look like your ListLogPlot

LogPlot[1/x, {x, 0, 1}, PlotRange -> {{-.1, 1}, All}, Frame -> True, 
 PlotPoints -> 1000001, MaxRecursion -> 0, 
 PlotRangePadding -> {{0, 0}, {Scaled[0.02], Scaled[0.05]}}]
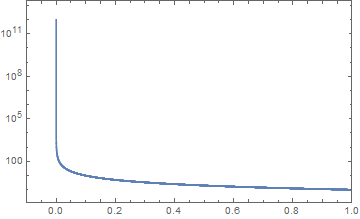
LogPlot

Using {x, 0, 1} together with PlotPoints -> 1000001 makes the plot start at 1.*10^-12 and end at 1 - 1.*10^-12. The PlotRangePadding is only added for an easier visual comparison, as the default is different for LogPlot and ListLogPlot.

Using such a high number of PlotPoints makes generating the plot much slower than using your ListLogPlot, which seems to be the better choice for this situation.


The problem generalized

Even a very simple plot like

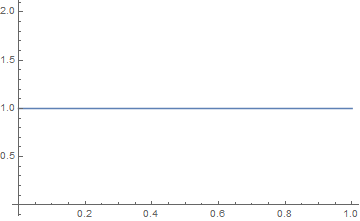
Plot[1, {x, 0, 1}]
enter image description here

does not start at x == 0 and end at x == 1, it starts at x == 2.040816326530612*^-8 and ends at x == 0.999999979591837. The only difference is, that here it isn't as obvious as in your 1/x case.
It is also worth pointing out, that this is not limited to the case where xmin is 0.

How to observe what is going on.

There is an extensive How does Plot work? Q&A that already analyses the inner workings of Plot. However, the problem that the function isn't plotted for xmin and xmax isn't part of it.

Let's first define a function that will print out its input and evaluate to 1

probe[x_] := (Print[NumberForm[x, Infinity]]; 1)

Using this function inside plot and extracting all the x values plotted

Cases[Plot[probe[x], {x, -1, 1}, PlotPoints -> 11, MaxRecursion -> 0, 
   PlotRange -> All], Line[x_] :> NumberForm[x[[All, 1]], Infinity], Infinity] // Flatten
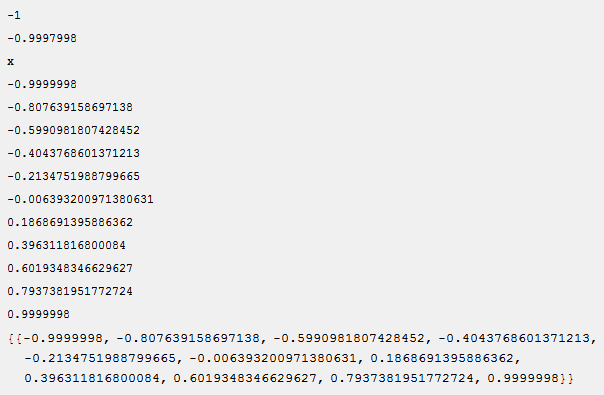
Out

shows, that the function probe is first evaluated for xmin == -1, than for an x value slightly bigger, than probe is evaluated symbolically (could be suppresses by defining probe only for numerical values) and finally probe is evaluated at the 11 plot points starting with a value between the first two evaluations.
$\endgroup$
0
3
$\begingroup$

Plot does not use open sampling on regions, so with the following we get the whole range:

Plot[1/x, {x} ∈ Line[{{10^-12}, {1}}], PlotRange -> All, Frame -> True]

Unfortunately, there's a bug in LogPlot:

LogPlot[1/x, {x} ∈ Line[{{10^-12}, {1}}], 
 PlotRange -> {{-.1, 1}, All}, Frame -> True]
(*  Graphics`LogPlotDump`scaledPlot[]  *)

So here's a workaround using Plot to mimic LogPlot.

ClearAll[logPlot];
SetAttributes[logPlot, HoldAll];
logPlot[f_, stuff__] := Plot[Log[f], stuff,
   Ticks -> {Automatic, Charting`ScaledTicks[{Log, Exp}]},
   FrameTicks -> {{Charting`ScaledTicks[{Log, Exp}], 
      Charting`ScaledFrameTicks[{Log, Exp}]}, {Automatic, Automatic}},
   CoordinatesToolOptions -> {"DisplayFunction" -> ({#1[[1]], Exp[#1[[2]]]} &), 
     "CopiedValueFunction" -> ({#1[[1]], Exp[#1[[2]]]} &)}];

logPlot[1/x, {x} ∈ Line[{{10^-12}, {1}}],
 PlotRange -> {{-.1, 1}, All}, Frame -> True]

Mathematica graphics

$\endgroup$
1
  • $\begingroup$ Note using the alternative form Method -> {ScalingFunctions -> {Log, Exp}} in Plot also crashes the kernel. $\endgroup$
    – Michael E2
    Commented Jul 11, 2015 at 14:21
2
$\begingroup$

Thanks for the explanation.

I think it is a bad philosophy of Plot. I may understand that it uses open interval but when I use option PlotRange->All I expect to see ALL points on the CLOSED interval. I had interpolated functions and wanted to see their behaviour on the boundary and the Plot[] was annoyingly misleading. Finally I defined my own LogPlot[] based on ListLogPlot[]:

MyLogPlot[fun_, range_, opts___] := 
  Module[{var = range[[1]], xmin = range[[2]], xmax = range[[3]],
    nn = PlotPoints /. Join[{opts}, {PlotPoints -> 30}], pts, optsi}, 
    pts = Function[Evaluate[var, {var, fun}]] /@ 
    Range[xmin, xmax, 1. (xmax - xmin)/nn];
    optsi = DeleteCases[{opts}, PlotPoints -> _];
  ListLogPlot[pts, optsi, Joined -> True, PlotRange -> All]]

the additional benefit is that it warns me when I plot interpolated function and exceed the interpolation domain. This is ignored by Plot[] which is again highly annoying, as it makes arbitrary extrapolation for interpolated function.

$\endgroup$
2
  • $\begingroup$ Just a side note: you can shorten var = range[[1]], xmin = range[[2]], xmax = range[[3]] in {var, xmin, xmax} = range $\endgroup$
    – Peltio
    Commented Jul 11, 2015 at 12:23
  • 1
    $\begingroup$ @Peltio better still use MyLogPlot[fun_, {var_, xmim_, xmax_}, opts___] := . . . $\endgroup$
    – Mr.Wizard
    Commented Jul 12, 2015 at 5:54
0
$\begingroup$

Let me give a practical workaround.

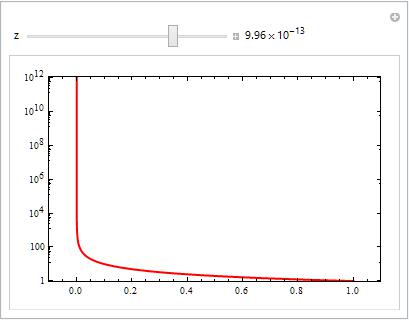
Plot the function as you would like with defined PlotPoints and PlotRange. FullForm shows you how to extract the first x-value x0. Plot the graph a second time and try with Manipulate how much starting value for x has to be varied.

lp = LogPlot[1/x, {x, 0, 1}, PlotPoints -> 100, 
   PlotStyle -> {Thick, Red}, PlotRange -> {{10^-12, 1}, All}, 
   PlotRangePadding -> .1, Frame -> True]

lp // FullForm;

x0 = First@Cases[lp, Line[{{uu_, _}, __}] -> uu, 4]

SetOptions[Manipulator, Appearance -> "Labeled"];

Manipulate[
 LogPlot[1/x, {x, -x0 + z, 1}, PlotPoints -> 100, 
  PlotStyle -> {Thick, Red}, PlotRange -> {{10^-12, 1}, All}, 
 PlotRangePadding -> .1, Frame -> True], 
 {z, -2 10^-12, 2 10^-12}]

enter image description here

$\endgroup$

Your Answer

By clicking “Post Your Answer”, you agree to our terms of service and acknowledge you have read our privacy policy.

Not the answer you're looking for? Browse other questions tagged or ask your own question.