8
$\begingroup$

I have a sequence of polytopes that I am trying to visualize, and I find that ConvexHullMesh sometimes excludes points from the convex hull, and it does so inconsistently.

In particular, notice these three convex hulls.
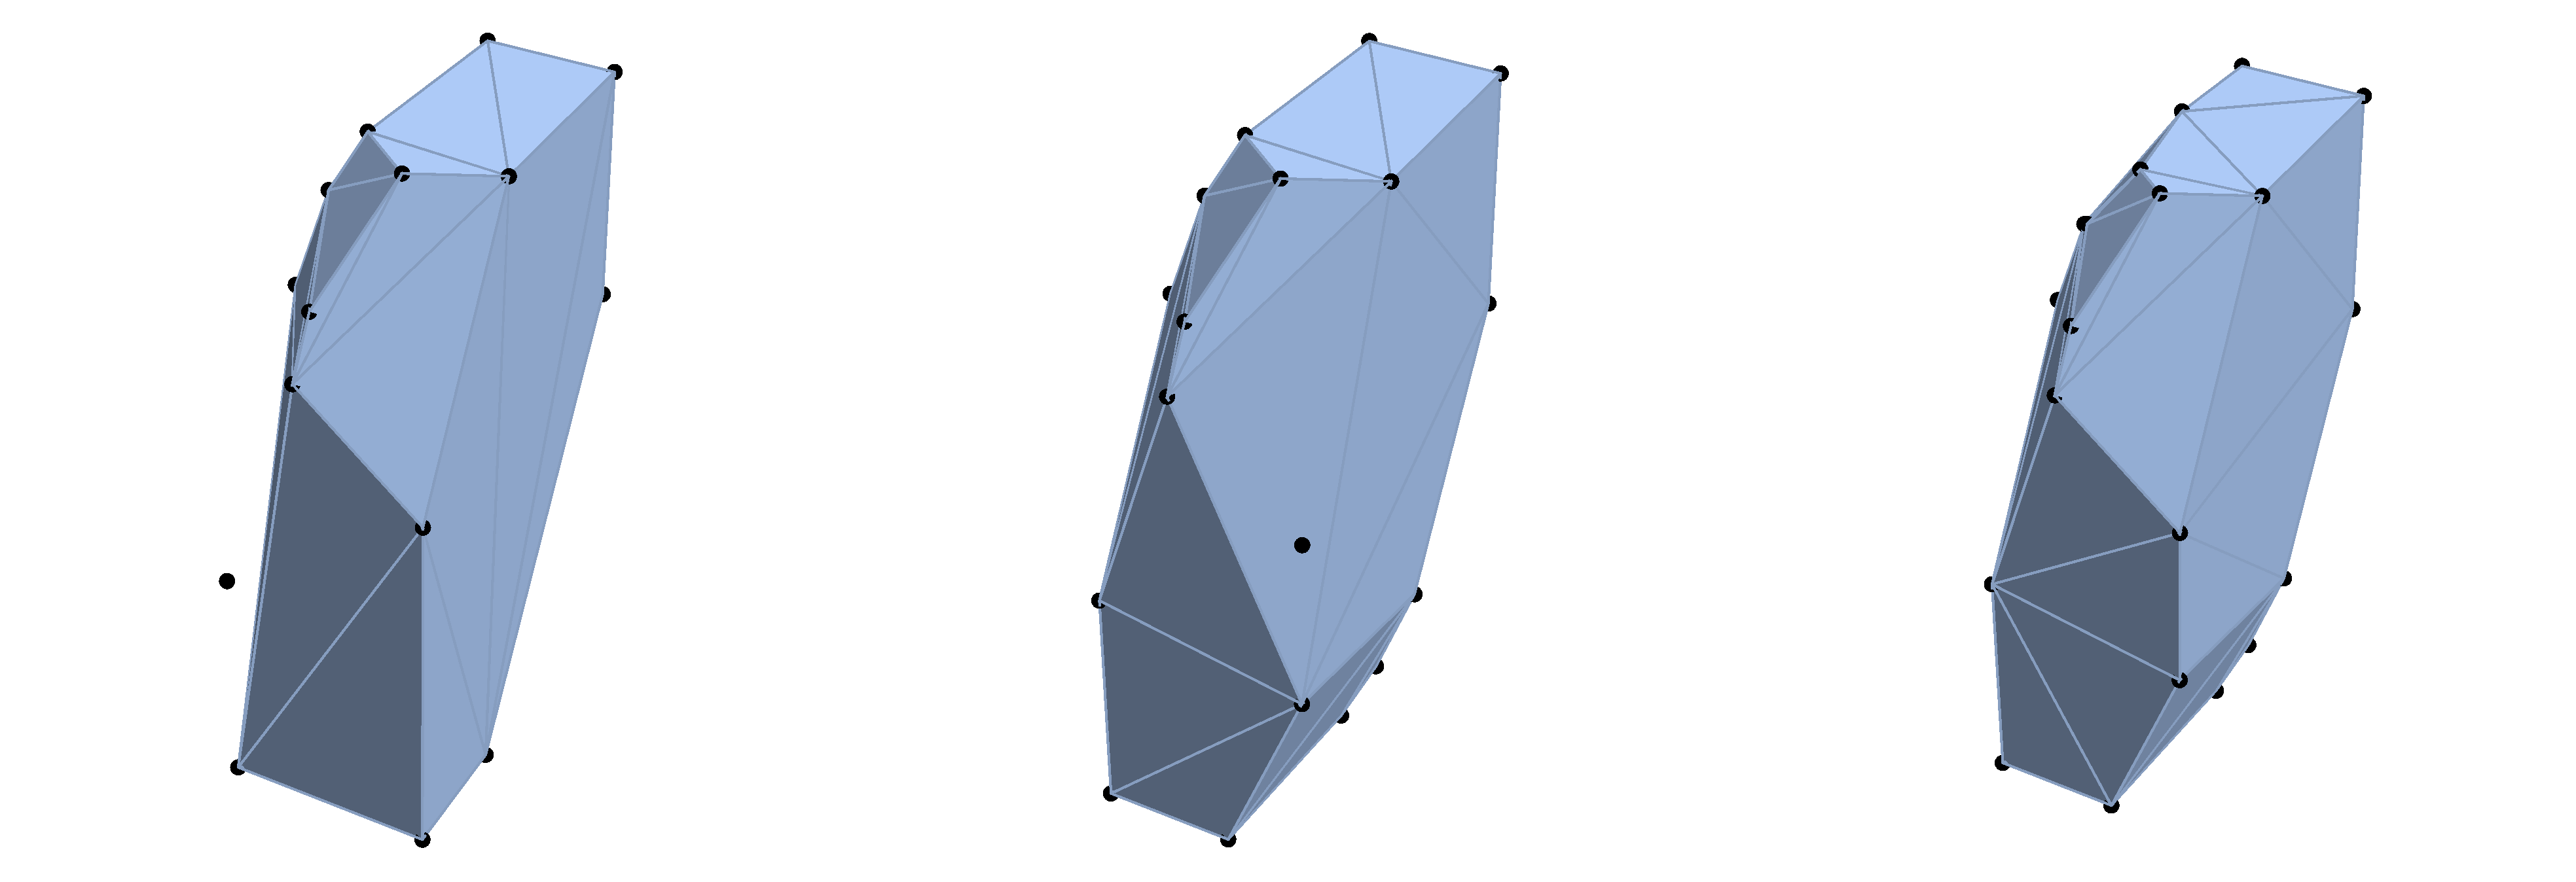
enter image description here

From left to right, the set of points is changing slightly -- a new plane (linear constraint) is added each time, which removes some vertices, but adds new ones as well. However, the convex hull drawn by Mathematica excludes different valid points in the first two plots, and includes them in the last one.

Regardless of how these points are generated, they should all be included in their convex hull (by definition), so this is clearly a bug.

Is anyone familiar with a workaround? Here is a gist of the data.

Edit: This is Mathematica 10.0.2.0 on OSX, and I generate the plots with

PlotPolytope[n_] :=
 Module[
  {
   V = Sort[
     Import["v-" <> ToString[n - 1] <> ".csv"]]
   },
  Show[
   ConvexHullMesh[V[[All, Range[1, 3]]]],
   Graphics3D[{Black, Point[V[[All, Range[1, 3]]]]}]
   ]
  ]

GraphicsGrid[
 {
  {PlotPolytope[8], PlotPolytope[9], PlotPolytope[10]}
  }
 ]

I am only using Sort because it emphasizes the bug. Without it the bug is still visible, but these three particular polytopes are displayed more consistently (but, I emphasize, incorrectly).

$\endgroup$
2
  • 1
    $\begingroup$ Which part of the data are you looking at? It's multi[ple columns. Also which version of Mathematica do you use. The one I tried looked fine. It would be useful if you could show the Mathematica command that generates these convex hulls. I.e. how should they be imported in Mathematica to reproduce the issue? $\endgroup$
    – user21
    Commented Jun 8, 2015 at 15:49
  • $\begingroup$ I use the first 3 columns. I made an edit with the rest of the details. $\endgroup$
    – Marcus P S
    Commented Jun 8, 2015 at 15:59

1 Answer 1

4
$\begingroup$

I got a reply from Mathematica indicating that it is a numerical precision issue (the Mathematica implementation of the convex hull seems to work at a lower precision than the data types used). Two work arounds are:

  1. Scale the data by a large number
  2. Approximate the data by rationals

In other words, use

PlotPolytope2[n_] := 
 Module[{V = 1000 Sort[Import["v-" <> ToString[n] <> ".csv"]]},
  Show[ConvexHullMesh[V[[All, Range[1, 3]]]], 
   Graphics3D[{Black, Point[V[[All, Range[1, 3]]]]}]]]

or

PlotPolytope3[n_] := 
 Module[{V = Rationalize[#, 10^-10] &@ Sort[Import["v-" <> ToString[n] <> ".csv"]]}, 
  Show[ConvexHullMesh[V[[All, Range[1, 3]]]], 
   Graphics3D[{Black, Point[V[[All, Range[1, 3]]]]}]]]
$\endgroup$
1
  • $\begingroup$ I still have the same problem after applying Rationalize[#,10^-30]. My convex hull is excludes many points that are included in the set that created it. $\endgroup$
    – Kvothe
    Commented Mar 29, 2021 at 15:53

Your Answer

By clicking “Post Your Answer”, you agree to our terms of service and acknowledge you have read our privacy policy.

Not the answer you're looking for? Browse other questions tagged or ask your own question.