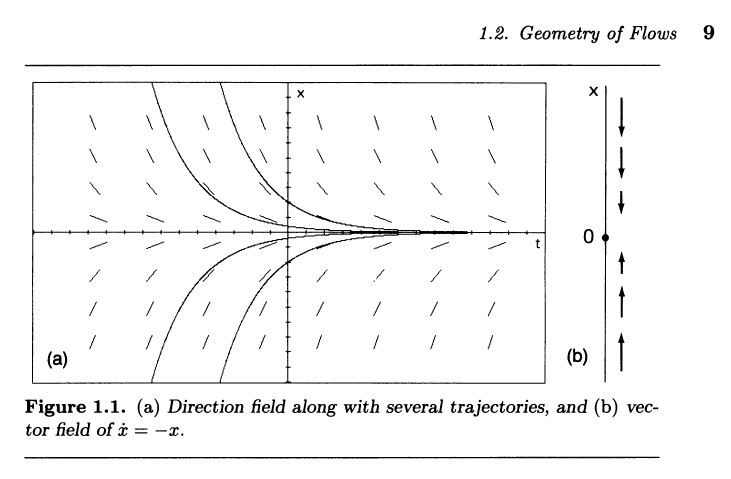
I am reading "Dynamics and Bifurcations" by Hale and Kocac, and in chapter one the following diagram is shown:

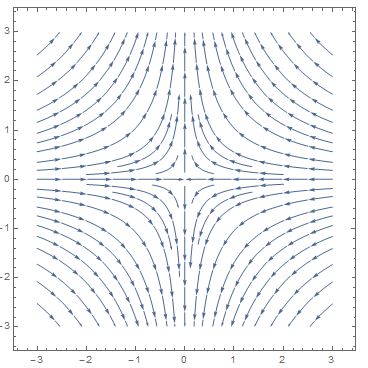
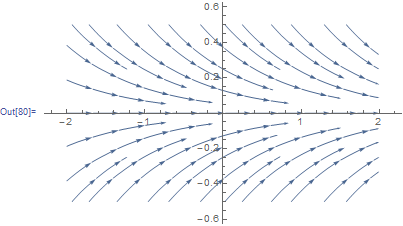
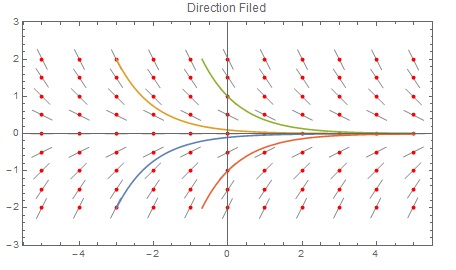
Question is, how can I achieve the same plot using Mathematica? I've tried StreamPlot, but the plot I get looks somewhat different:
StreamPlot[{-x, t}, {x, -3, 3}, {t, -3, 3}]

What horrible mistake have I made? Sorry, but I'm fairly new to both ODEs and Mathematica. Thanks for the help.


