3
$\begingroup$

Here's a small example this is not the real curve but a simple example I made for this question.

Here's the plot of a list with a point A of known coordinates.
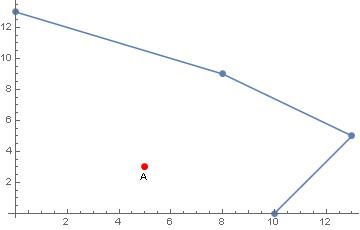
Figure 1

Now I need to find if the point A is in the region bounded by the curve and the axes. I thought of creating a line passing through the origin and point A and finally intersecting the curve at a point B like in the figure below.
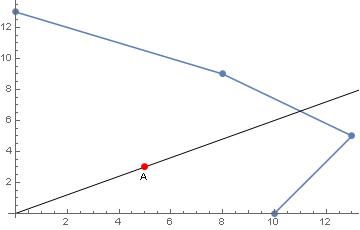
Figure 2

The next thing is to find the distance between A and the origin and compare it with the distance between B and the origin O. If OA is smaller than OB it means the point is in the region. But I don't know how to find the distance OB since I can't determine the coordinates of B. Is there anyway to do this? Are there any other suggested methods?Thank you.

$\endgroup$
2
  • $\begingroup$ I edited the question, you're right. $\endgroup$
    – Mr. Pi
    Commented Mar 1, 2015 at 15:29
  • $\begingroup$ [CapitalSigma]id[Theta]i, where d[Theta]i is the angle between the \ ith and the (i + 1)th coordinates. If the sum is zero, the point is outside the curve. If the sum is 2 Pi, the point is inside the curve. If you need more information, you can inbox me to wondtassew(AT)gmail(DOT)com. I found the technique very useful for the work I do. $\endgroup$
    – Wondesen
    Commented Mar 9, 2017 at 4:17

2 Answers 2

8
$\begingroup$

For this particular example versio 10 functionality is helpful:

list = {{0, 13}, {8, 10}, {13, 6}, {10, 0}};
pg = {{0, 0}}~Join~list;
rm[x_, y_] := RegionMember[Polygon[pg], {x, y}]

You can see criteria:

Reduce[rm[x, y]]

yielding: (0 <= y <= 6 && 0 <= x <= (20 + y)/2) || (6 < y <= 10 && 0 <= x <= 1/4 (82 - 5 y)) || (10 < y < 13 && 0 <= x <= 1/3 (104 - 8 y)) || (y == 13 && x == 0)

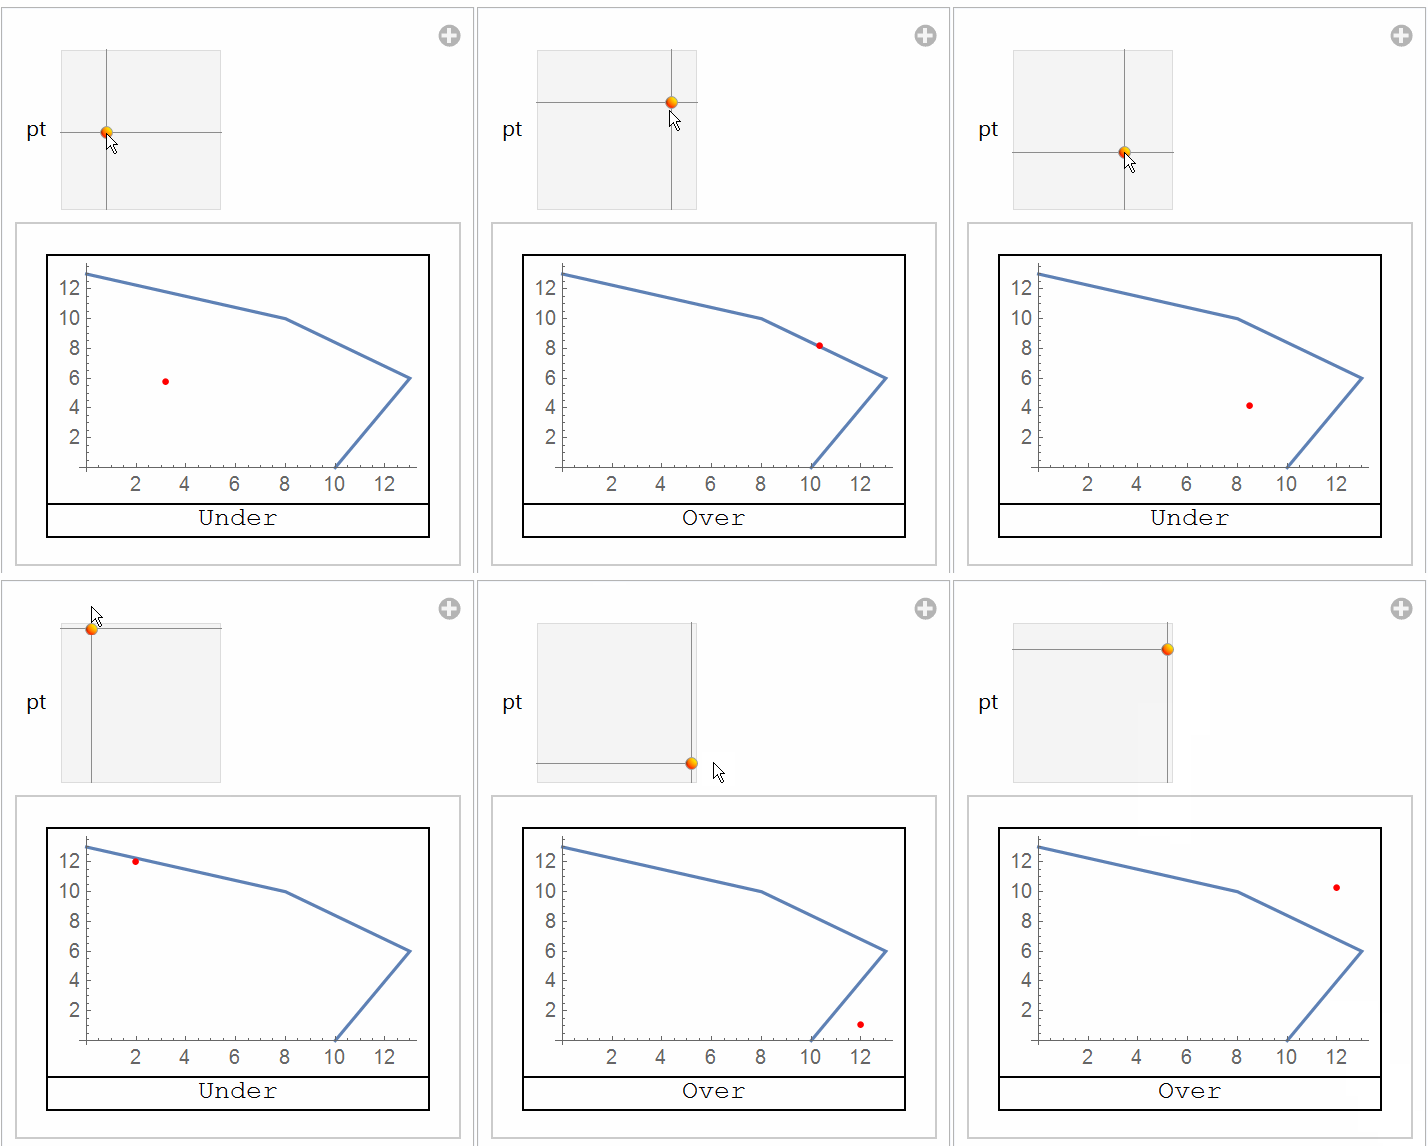
Visualizing:

Manipulate[
 Column[{ListPlot[list, Joined -> True, 
    Epilog -> {Red, PointSize[0.02], Point[pt]}], 
   rm @@ pt /. {True -> "Under", False -> "Over"}}, 
  Alignment -> Center, Frame -> All], {pt, {0, 0}, {12, 12}}]

enter image description here

$\endgroup$
3
  • $\begingroup$ Thank you. The visualization is great. I didn't think abiut creating a region but it seems this is the only way to do it. Thanks again. $\endgroup$
    – Mr. Pi
    Commented Mar 1, 2015 at 13:21
  • $\begingroup$ @Mr.Pi I am sure there are many ways to do this and more general. You may wish to wait and revise choice should you see better answer, eg more general, clearer more efficient. Thank you for the vote if this is sufficient for you. $\endgroup$
    – ubpdqn
    Commented Mar 1, 2015 at 13:25
  • $\begingroup$ Yes it is sufficient for me and what I'm working on. $\endgroup$
    – Mr. Pi
    Commented Mar 1, 2015 at 13:55
5
$\begingroup$

Try this:

list = {{0, 13}, {8, 10}, {13, 6}, {10, 0}};
A = {5, 3};

f = Interpolation[list, InterpolationOrder -> 1];
If[f[A[[1]]] < A[[2]], "Over the curve", "Under The curve"]
(*"Under The curve"*)

Based on your comment, you are looking to check if the point is enclosed within the curve and the line y = 0. You can try this:

list2 = Join[{{0, list[[1, 2]]}}, list, {{0, list[[-1, 2]]}}];
p = Polygon[list2];
A ∈ p
$\endgroup$
3
  • $\begingroup$ note that point {10,4} would be "Over the curve" by your conditional but "under the curve" of original post $\endgroup$
    – ubpdqn
    Commented Mar 1, 2015 at 12:33
  • 1
    $\begingroup$ This won't work. Imagine a point of coordinates {13,1} it's not under the curve, it's not contained within the curve but your function f will show it as under. $\endgroup$
    – Mr. Pi
    Commented Mar 1, 2015 at 12:38
  • $\begingroup$ Thank you. The edited part worked. $\endgroup$
    – Mr. Pi
    Commented Mar 1, 2015 at 13:22

Your Answer

By clicking “Post Your Answer”, you agree to our terms of service and acknowledge you have read our privacy policy.

Not the answer you're looking for? Browse other questions tagged or ask your own question.