7
$\begingroup$

I would like to color some lines according to the following color function:

AngleColor[x_] := Module[{
   a = ArcCos[{1, 0}.Normalize[x]]/(Pi)},
  If[a >= 0.5,
   Blend[{White, Orange, Orange, Purple, Purple, White}, 2 (a - 0.5)],
   Blend[{White, Purple, Purple, Orange, Orange, White}, 2 a]]]

This function works as intended with the following test data:

testLines = Table[{{0, 0}, {Cos[x], Sin[x]}}, {x, 0, 2 Pi, Pi/600}];
Show[
 Graphics[{AngleColor[#[[2]] - #[[1]]], Line[#]}] & /@ testLines,
 Background -> Black]
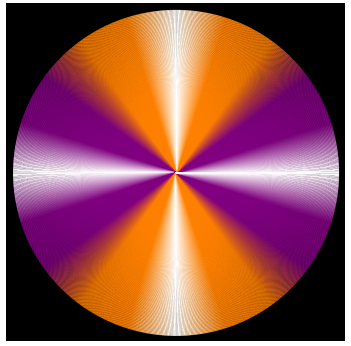
enter image description here

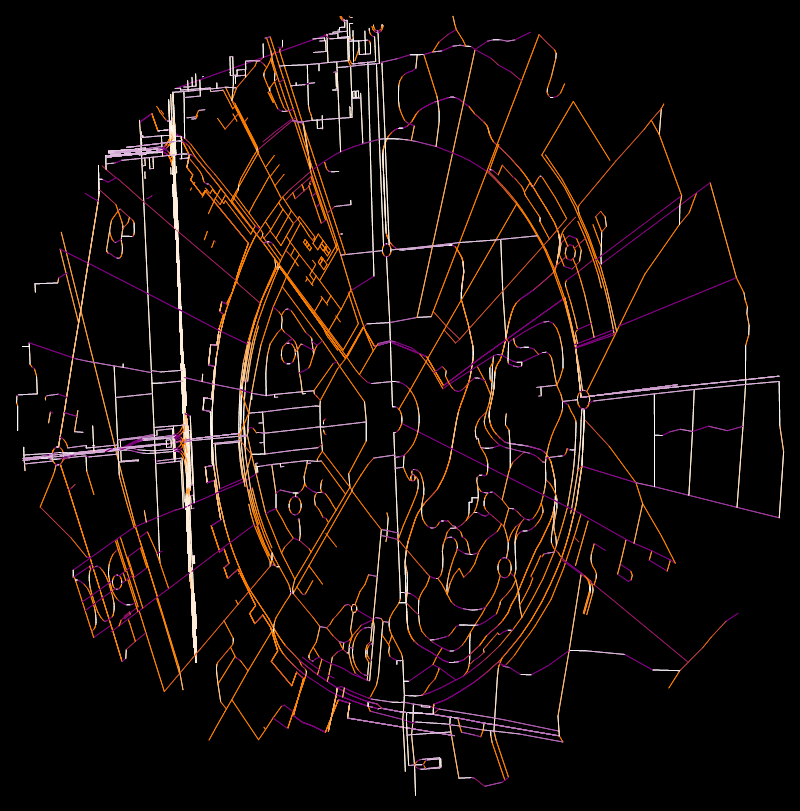
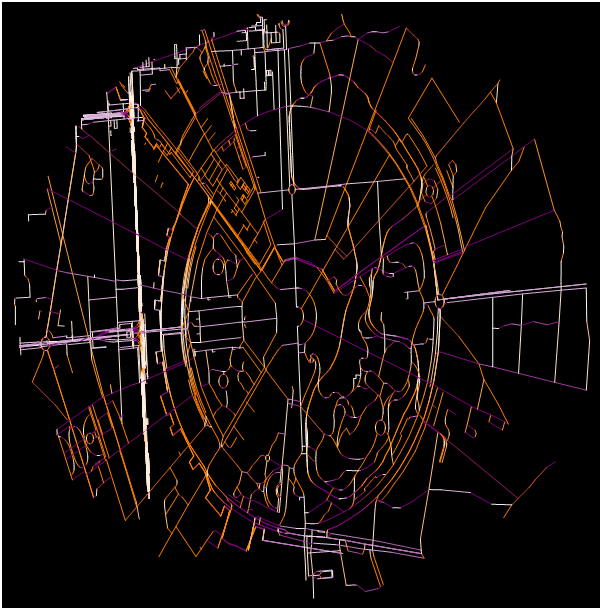
But I dont get the desired result with my real data. Some lines are clearly parallel but have very different colors. Some lines even change color without a change in direction. Any ideas whats going on here?

testD = ToExpression@Import["http://pastebin.com/raw.php?i=jgYKrHNr", "Data"]
Show[
 Graphics[{AngleColor[#[[2]] - #[[1]]], Line[#]}] & /@ # & /@ testD, 
 Background -> Black, ImageSize -> 800]
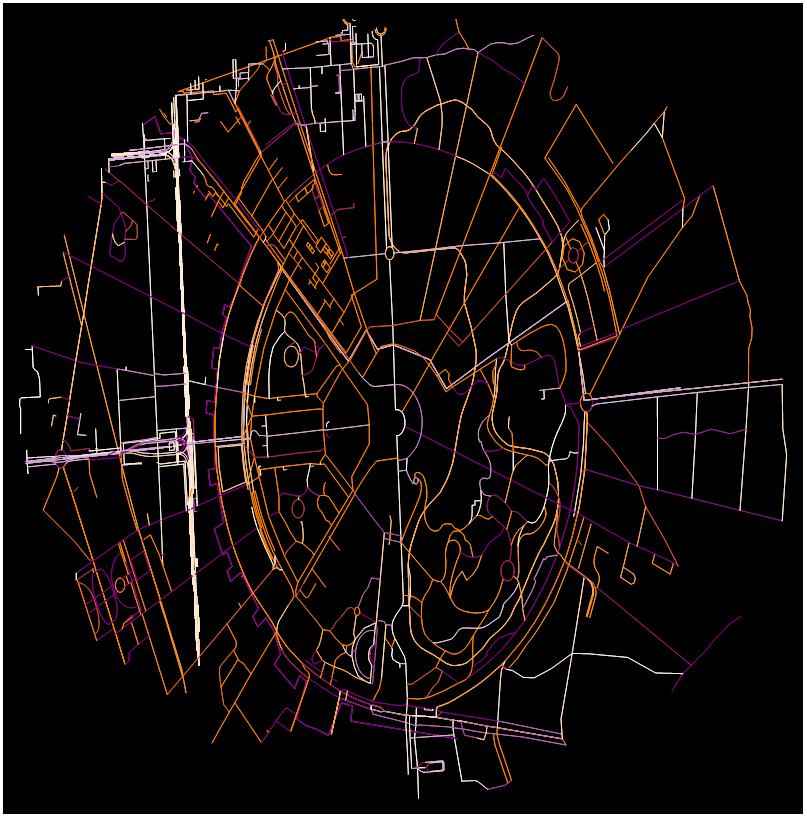
enter image description here

$\endgroup$

2 Answers 2

9
$\begingroup$

Most of your lines are "multipoint" and your color function doesn't support them well. You can enforce "two points lines" by doing something like this (I'm following your map code styling here):

Show[Graphics[{AngleColor[#[[2]] - #[[1]]], Line[#]}] & /@ 
      Partition[#, 2, 1] & /@ # & /@ testD, Background -> Black, ImageSize -> 800]

But I would rather prefer this other way:

angleLine[x_] := 
 Module[{a = ArcCos[{1, 0}.Normalize[Subtract @@ x]]/(Pi)},
        {If[a >= 0.5, Blend[{White, Orange, Orange, Purple, Purple, White}, 2 (a - 0.5)], 
                      Blend[{White, Purple, Purple, Orange, Orange, White}, 2 a]], Line@x}]

Show[Graphics[Map[angleLine /@ Partition[#, 2, 1] &, testD, {2}],
             Background -> Black, ImageSize -> 800]]

Mathematica graphics

$\endgroup$
1
$\begingroup$

Using VectorAngle and Developer`PartitionMap:

aclF[x_] := Module[{a = VectorAngle[{1, 0}, Subtract @@ x]/Pi},
   {If[a >= .5, Blend[{White, Orange, Orange, Purple, Purple, White}, 2 (a - .5)],
    Blend[{White, Purple, Purple, Orange, Orange, White}, 2 a]], Line@x}];

Graphics[Developer`PartitionMap[aclF, #, 2, 1] & @@@ testD, 
  Background -> Black, ImageSize -> 600]

enter image description here

$\endgroup$

Your Answer

By clicking “Post Your Answer”, you agree to our terms of service and acknowledge you have read our privacy policy.

Not the answer you're looking for? Browse other questions tagged or ask your own question.