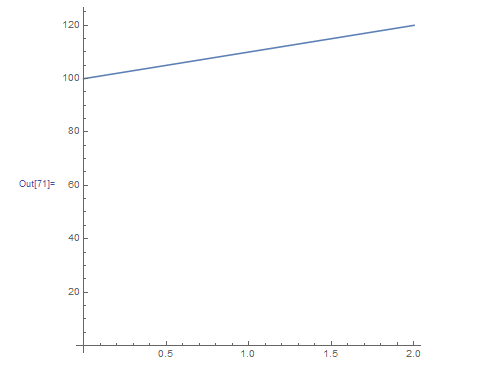
I want to plot some data in a ListLinePlot where the x- and y-values differ by at least 2 orders of magnitude. In this plot the x- and y- axis should not be scaled differently. This is the result that I achieved with the AspectRatio option:
ListLinePlot[{{0, 100}, {1, 110}, {2, 120}}, AxesOrigin -> {0, 0}, AspectRatio -> 1]

I thought AspectRatio->1 will scale the x- and the y-axis in the same way, but instead only the distance between the ticks is the same. For example the x-axis value 0.4 and the y-axis value 20 have the same distance from the origin (both have 4 ticks).
I could fix this problem with specifiying PlotRange -> {{0, 120}, {0, 120}}, but I wonder if there is way to achieve the desired result without specifiying the plot range?

AspectRatio->Automaticdoes what you need. $\endgroup$AspectRatio->Automaticwill use the same scale on both axes; however, you will need to change theAxesOriginandImageSizeto get a useful result. For example,ListLinePlot[{{0, 100}, {1, 110}, {2, 120}}, AxesOrigin -> {0, 100}, AspectRatio -> Automatic, ImageSize -> 100]$\endgroup$