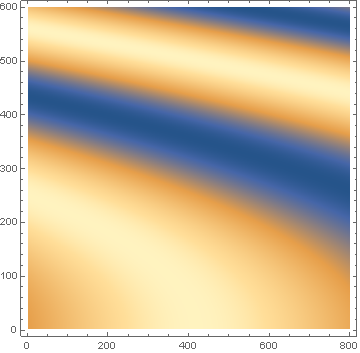
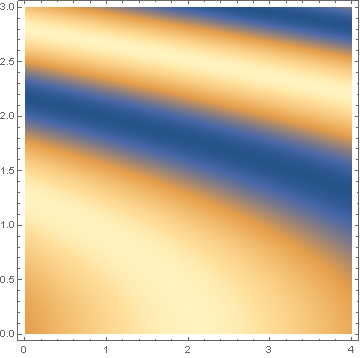
I have a matrix of size 800x600 in which each value is basically z value. This matrix is stored in text file. I want to import the file in Mathematica and plot it as DensityPlot using ListDensityPlot. In doing so, I am able to plot the data but the x and y axis scale as 0 to 800 and 0 to 600 respectively indicating basically indices of the values stored in the matrix. But in reality I want to scale both x and y axis lets say x ranges from 0 to 4 and y ranges from 0 to 3. In other words I want to keep full scale of the plot with all the data while my frame ticks on x and y axis scaled from 0 to 4 and 0 to 3 respectively.
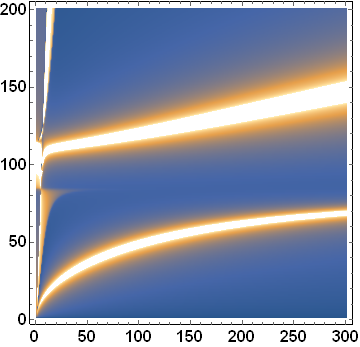
For example, when I import the data (here my data is matrix of size 301x201)and plot it, it looks this, here basically it takes x and y axis tick values as data indices in the matrix
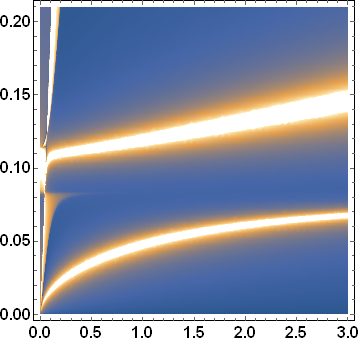
But actually, in my plot I want to change the axis tick values like this way keeping everything else as it is


