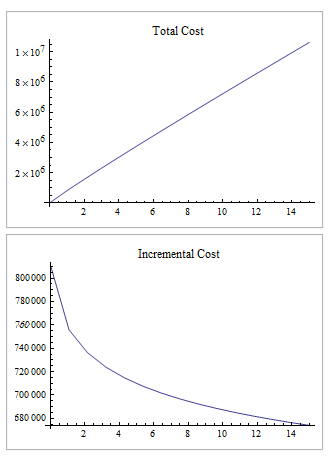
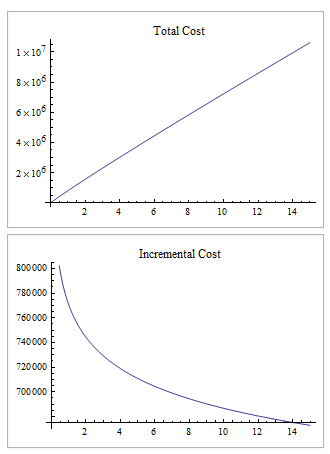
Trying to show a plot of a power function $Y = a X^b$, where $Y$ is cumulative cost and $X$ is cumulative shipments where we'd like to see the incremental cost.
For $X_1$ the cost is $Y_1$, for $X2$ the cost is $Y_2 - Y_1$ for just the second unit shipped, for $X3$ the cost is $Y_3 - Y_2$ for just the third unit shipped... and so on.
I have a model of $\text{CumulativeCosts} (Y) = a \text{CumulativeShipments} (X) ^ b$ where $a$ is $8.11\times10^5$ and $b$ is $0.95$.
I'm having trouble creating the data give the above function such that we see a decreasing individual unit cost as more units are shipped. (like a decreasing exponential curve...)
I tried:
ListPlot@Table[
 (811014.9219997985` x^0.9495224913459213`)-
 (811014.9219997985` y^0.9495224913459213`),
 {x, 1, 15}, {y, 0, 14}
]
The result is a dot plot of 15 $y$ values for each of the 15 $x$ values
Ideally I'd like a smooth curve showing the decrease in cost as more units ship.
There has to be a way to create a table of number of units shipped and the cost of the $i^\text{th}$ unit shipped?


