What Method options are allowed for DensityPlot and ContourPlot? I am unable to find this information either in MMA documentation or in SE. Thanks.
2 Answers
As far as I know there is no documented list of Method options for ContourPlot and DensityPlot. If you want to experiment there is a large list of strings in Charting`CommonDump`$VisualizationMethodOptions to have a look at. Some of these are option settings, some are option values. Most seem to have no effect on a simple ContourPlot and probably apply to different visualization functions or only apply in specific circumstances.
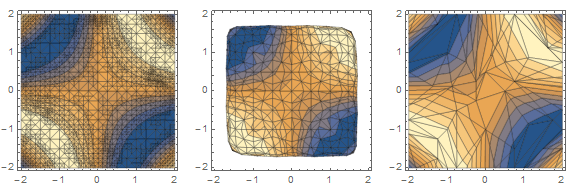
For an example here are a couple that affect the creation of the mesh:
GraphicsRow[
 ContourPlot[Sin[x y], {x, -2, 2}, {y, -2, 2},
    Mesh -> All, PlotPoints -> 5, Method -> {#}] & /@
  {Automatic, "Subdivision" -> "Loop", "PolygonReduction" -> 100}]

This is the complete list:
{"ScalingFunctions", "PlotRandomSeed", "DraftRendering", "ArrayPlot",
"InvertNormalsDirection", "BoundaryOffset", "Refinement",
"MeshBoundaryValues", "StepsJoined", "SurfaceStitch",
"UnboundedPolygons", "InterpolateMesh", "DownsampleWindow",
"FilterMeshAll", "OriginalCoordinates", "ReturnMeshObject",
"ReturnRawMeshObject", "MeshMaxRecursion", "ContourMaxRecursion",
"DelaunayDomainScaling", "PolygonReverse", "VertexAliasTolerance",
"Average", "Fan", "Seidel", "Constrained", "GradientAligned",
"MeshRegions", "PathPolygons", "SimplifyPaths",
"PackGraphicsComplex", "SnapContourVertex", "PlotTheme",
"VertexColorsPalette", "VectorBackgroundPadding", "ReturnImage",
"Closed3DRegion", "PolygonColoring", "Equalized", "EqualizeColor",
"ColorFunctionData", "Valence", "Laplace", "Conformal",
"RGBColorSpace", "GrayColorSpace", "ParallelPlotEvaluate",
"ParallelPlotMethod", "ParallelPlotParameters", "LightingMethod",
"DiffuseReflection", "AspectBasedShading", "Contrast", "Brightness",
"Saturation", "SpatialResolution", "ElevationDefault",
"IlluminationModel", "AngularDistanceRadius", "UseNumericalFunction",
"NumericalFunction", "FlattenFunctions", "SuppressMessages",
"MessagesHead", "MappingFunctions", "DomainMappingFunctions",
"LegacyColorFunctionProcessing", "ContourShadingPrefixFunction",
"ContoursPrefixFunction", "UseCaching", "CutMeshLines",
"FillBoundaryLines", "Ungroup", "CloseMeshThickness",
"ClipNoneMeshShading", "ClipAtPlotRange", "ClipMeshOverlay",
"ClipBoundaryLines", "Subdivision", "CellDecomposition", "Divisions",
"ControlValue", "VertexTolerance", "MaxBoundaryEdgeLength",
"CellCuboids", "Dihedral", "Gaussian", "GradientNorm", "Loop",
"Contouring", "Curvature", "ContourLevel", "PlanarRectangular",
"Triangular", "Quad", "QuadTriangular", "Length", "Area",
"Perimeter", "BhatiaLawrence", "AverageNormal", "WeightedNormal",
"Barycenter", "Cotangents", "Circumcenter", "Incenter", "Inradius",
"Circumradius", "InteriorAngles", "Dual", "OFF", "NOFF", "Frenet",
"NaturalNeighbour", "InverseDistance", "Kriging", "MaxMemoryUse",
"Intersect", "FullLattice", "MarchingCubes", "AdvancedMarchingCubes",
"AdaptiveTriangular", "Octree", "OctreeCubes", "Algebraic",
"Cubical", "Tetra", "Seeds", "Linear", "Bisect", "NoiseDelta",
"ContourSpacing", "MeshSpacing", "Quantile", "CurveLength",
"ArcLength", "DataLineMesh", "DataPointMesh", "GraphicsIndex",
"SymbolicPiecewiseSubdivision", "pw", "PiecewiseTimeConstraint",
"SymbolicPointsTimeConstraint", "Singularities", "Isolated",
"SingularCurves", "SingularMaxRecursion", "ExclusionsOffset",
"PolygonReduction", "Polygons", "PolygonContraction",
"PointPlacement", "QuadricWeighting", "CompactnessRatio",
"MeshPenalty", "BoundaryWeight", "EndPoint", "EndOrMidPoint",
"LinearPoint", "OptimalPoint", "UniformWeight", "AreaWeight",
"AngleWeight", "AverageWeight", "AreaAverageWeight", "NormalWeight",
"VerticesGoal", "EdgesDistanceGoal", "MinArea",
"PreserveInteriorFaces", "SegmentPartition", "SegmentLengthGoal",
"LegendsFunction", "Legend", "Extrapolation", "Interpolation",
"PointsToSpheres", "Caps", "ConnectEnds", "StreamlinesMethod",
"StreamlinesSamplingStep", "StreamlinesInsertionStep",
"StreamlinesParameterLimit", "StreamlinesNDSolve",
"StreamlinesNumericalFunction", "LICLines", "LICMinHits",
"LICMaxLines", "AccuracyGoal", "PrecisionGoal", "HSBChannel",
"LICModulate", "NewtonFlow", "PerturbateFrame", "PerturbateSeeds",
"ParseGlyphStyle", "LinePath", "LineArrow", "GlyphPath",
"Directional", "DirectionalScaled", "Velocity", "VelocityScaled",
"ControlPoints", "BSplineCurve", "BezierCurve", "NURBSCurve",
"XSplineCurve", "BSplineShape", "BezierShape", "NURBSShape",
"XSplineShape", "SharedMemoryReference", "Method", "Automatic",
"None", "All", "True", "False"}
-
3$\begingroup$ How did you obtain this list? Thanks. $\endgroup$ Commented Dec 22, 2014 at 0:01
-
$\begingroup$ Man, this is awesome! Thanks! Could you elaborate on how you found the corresponding control stringt like the "Loop" in your given example? Was this just straight up trying? Edit: I found the refinement method suuuuper helpful to fine tune the meshing used in density and contour plots. Use with Method->{"Refinement" -> {"ControlValue" -> 3 Degree}} ... together with MaxRecursion and PlotPoints one can find a very nice local adaptive sampling in most cases $\endgroup$ Commented Mar 18, 2021 at 18:02
-
$\begingroup$ I think it was just automated trying different combinations and seeing which ones changed the output. $\endgroup$ Commented Mar 18, 2021 at 19:06
One should not be confused with method or option.
A method in the sense of Mathematica (See: Method)

Options in the sense of Mathematica (See: Options)

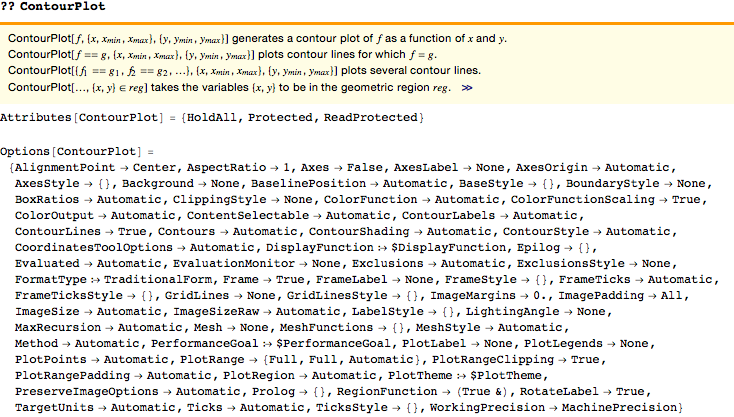
For DensityPlot or ContourPlot you can query for Options with ??DensityPlot or with ??ContourPlot:

The Link provided by @Karsten 7. (answer by @Nasser), is a really fabulous strategy to "unearth" the methods to a function.
For example (algorithm omitted) with:
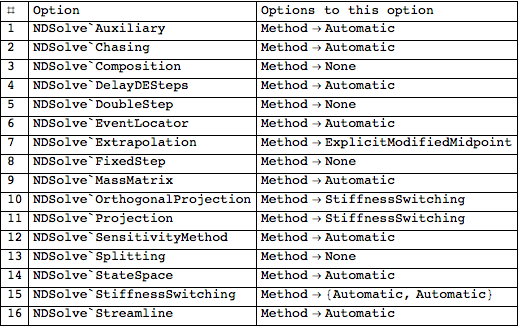
r = getList2["NDSolve"];
Grid[r, Frame -> All, Alignment -> Left]
all "Methods" approved for NDSolve are listed:

Edit
Since DensityPlot, ContourPlot and others have the same options as Graphics those rules are applicable (see Graphics and see "The following Method options can be given" ibid. For Functions Mathematica states:
With the default setting Method->Automatic, the Wolfram Language will automatically try to pick the best method for a particular computation.
See Method.
-
1$\begingroup$ I agree that "the link provided by @Karsten 7. (answer by @Nasser), is a really fabulous strategy to "unearth" the methods to a function." However, although it works well for
"NDSolve"and"NIntegrate", it returns no useful information for"DensityPlot"or"ContourPlot". $\endgroup$ Commented Dec 21, 2014 at 18:39 -
$\begingroup$ True, but with ??ContourPlot you will retrieve all Options aviable, hence "Method" is only applicable to Functions with Method. $\endgroup$– user9660Commented Dec 21, 2014 at 18:45
-
2$\begingroup$ indeed,
??ContourPlot, likeOptions[ContourPlot], returns a long list of options, includingMethod->Automatic. I wish to know what those methods are. (@Karsten7 identifies some of them in an earlier comment.) I should add that @Nasser provides two functions,getListandgetList2. Neither returns information for "DensityPlot" or "ContourPlot". $\endgroup$ Commented Dec 21, 2014 at 19:02

Optionsfor"DensityPlot"or"ContourPlot", even though with"NIntegrate" it worked fine. Suggestions? $\endgroup$AbsoluteOptions[ DensityPlot[Sin[x] Sin[y], {x, -4, 4}, {y, -3, 3}], Method ]gives{Method -> {"DefaultBoundaryStyle" -> Automatic, "DefaultPlotStyle" -> Automatic, "ScalingFunctions" -> None}}$\endgroup$