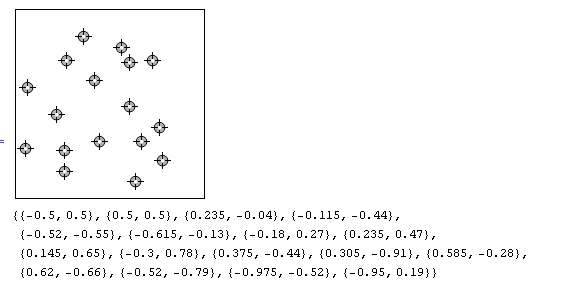
The following code is usable and does the trick, except it does not permit constraining entry points to specific values, for example even numbers on the horizontal axis (like years for example). Still, it does everything else, and also permits very flexible adjustment of the size and shape of the input space, so I think it is worth sharing. Instructions follow, and the code begins at the row of ================ signs
Instructions:
You can: add to and adjust data in pts which initially contains one point located at {0,0}. Then save the result by clicking the Button called "Press to Save Edited Data"
Detailed directions:
1--Drag the initial point, located at {0,0} , to where your first point should be.
2--To move a data point, drag it with left mouse button.
3--To add a datapoint you must use alt-click.
4--To remove a datapoint cover it and press alt-click.
5--Once the points are as you like them, press the Save Edited Data Button.
=======================================
Remove[pts, newpts,
 numbrHgrdLns, vmax, vmin, disTweenHgrdLns, locsHgrdLns,
numbrVgrdLns, hmax, hmin, disTweenVgrdLns, locsVgrdLns, i, j, imgSze,
data, asPr]

Manipulate[Column[{
   {"Number of horizontal gridlines: ",
    numbrHgrdLns = IntegerPart[(vmax - vmin)/disTweenHgrdLns]};
   locsHgrdLns =
    vmin + Table[i disTweenHgrdLns, {i, 1, numbrHgrdLns}];

   {"Number of vertical gridlines: ",
    numbrVgrdLns = IntegerPart[(hmax - hmin)/disTweenVgrdLns]};


   locsVgrdLns = hmin + Table[j disTweenVgrdLns, {j, 1, numbrVgrdLns}];

   ListPlot[{{{hmin, vmin}, {hmax, vmax}}, pts},
    PlotRange -> {{hmin, hmax}, {vmin, vmax}},
    PlotStyle -> Directive[Red, PointSize[.03]],
    GridLines ->
     {locsVgrdLns, locsHgrdLns},
    GridLinesStyle -> {{Red, Thick}, {Orange, Thick}},
    ImageSize -> imgSze, AspectRatio -> 2/asPr],
   Dynamic[newpts = pts]}],

 {{vmax, 11, "Vertical max. of graph space: "}, FieldSize -> Tiny},
 {{vmin, 0, "Vertical min. of graph space (Neg. value ok): "},
  FieldSize -> Tiny},
 {{disTweenHgrdLns, 1.000, "Distance between horizontal gridlines: "},
   FieldSize -> Tiny},
 {{hmax, 23, "Horizontal max. of graph space: "}, FieldSize -> Tiny},
 {{hmin, 0, "Horiz. min. of graph space: "}, FieldSize -> Tiny},
 {{disTweenVgrdLns, 2.000, "Distance between vertical gridlines: "},
  FieldSize -> Tiny},
 {{imgSze, 200, "Enlarge size of graph via slider: "}, 200, 2000},

 {{asPr, 2, "Graph aspect ratio --make graph flatter/taller: "}, .5,
  10},

 {{pts, {{0, 0}}}, Locator, LocatorAutoCreate -> True},
 ControlPlacement -> Top]
pts
Button["Press to Save Edited Data",
 Put[newpts, StringJoin[NotebookDirectory[], "savedDta.m"]]]


