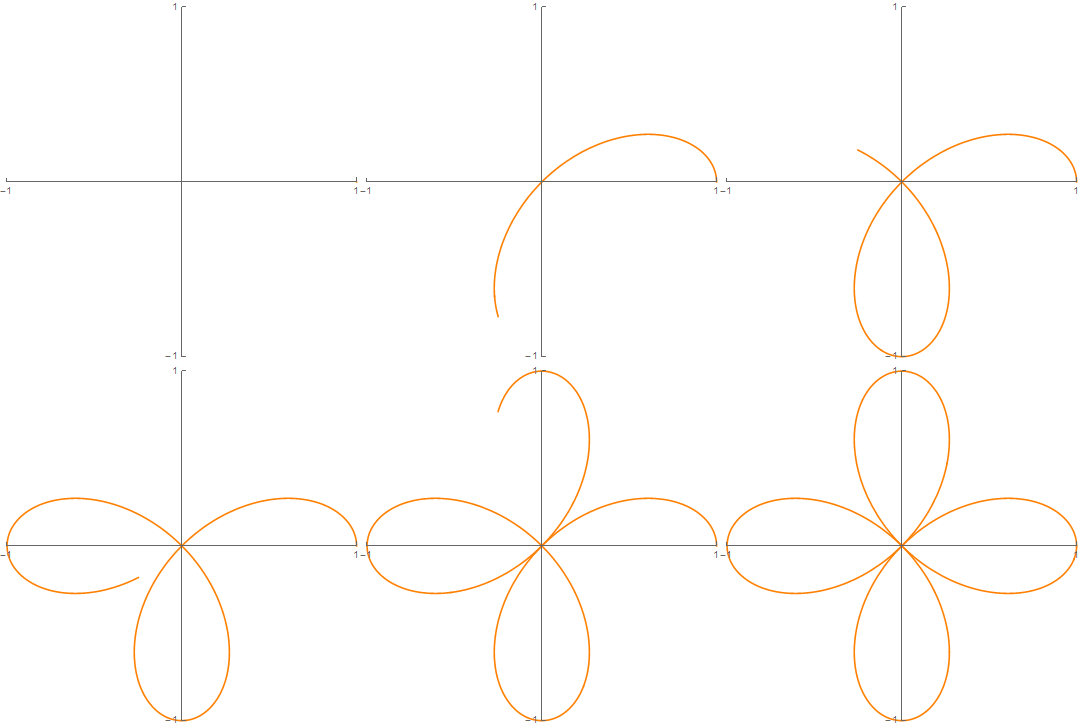
I want to export an animation(gif type) for polar plot $r=\cos 2\theta$ like to the following gif. how can I do it?

rose = Table[PolarPlot[Cos[x i], {i, 0, Pi}, PlotRange -> 1], {x, 0, 10, .1}];
Followed by:
Export["rose.gif", rose]
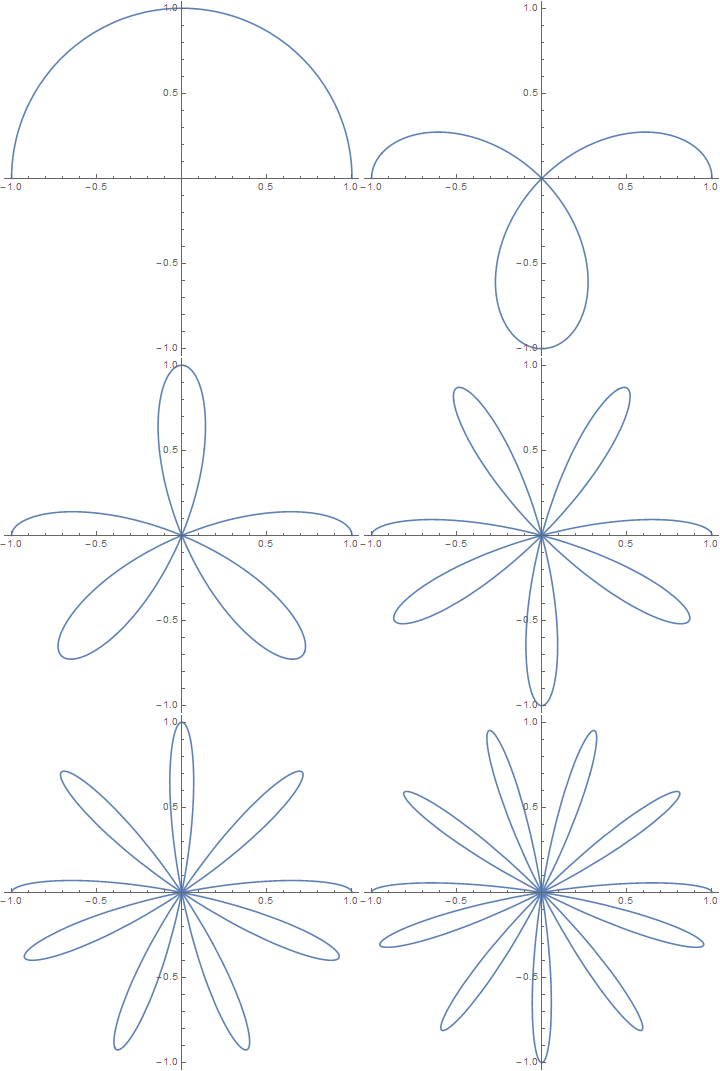
Which gives you the following beautiful animation:

You can change the final number of petals by changing the number 10. You can change the speed of the animation by making the increments smaller than .1.
To realize the constant-speed drawing, you'll need to re-parameterize the equation to use the arc-length parameter:
$$ \mathrm{d}s = \left\| \frac{\mathrm{d}\,\boldsymbol{\mathrm{r}}(\theta)}{\mathrm{d}\theta}\right\|\mathrm{d}\theta $$
r = Cos[2 θ] {Cos[θ], Sin[θ]}
reParaEq = θ'[s] == 1/FullSimplify[Sqrt[#.#] &@D[r, θ] /. θ -> θ[s]]
θFunc = DSolveValue[{reParaEq, θ[0] == 0}, θ, s][s]
(* And the max value of the arc-length: *)
{sMax} = s /. Solve[θFunc == 2 π, s]
To actually plotting the expected result, we need to turn off MaxRecursion:
wholePlot = ParametricPlot[Evaluate[r /. θ -> θFunc], {s, 0, sMax},
                           PlotPoints -> 200, MaxRecursion -> 0
                          ]
frames = wholePlot /. ({Line[pts_] :> Line[pts[[;; #]]]} & /@ Range[200]);
To show the animation in Mathematica, we can use ListAnimate:
ListAnimate[frames, 60]
To export it as GIF:
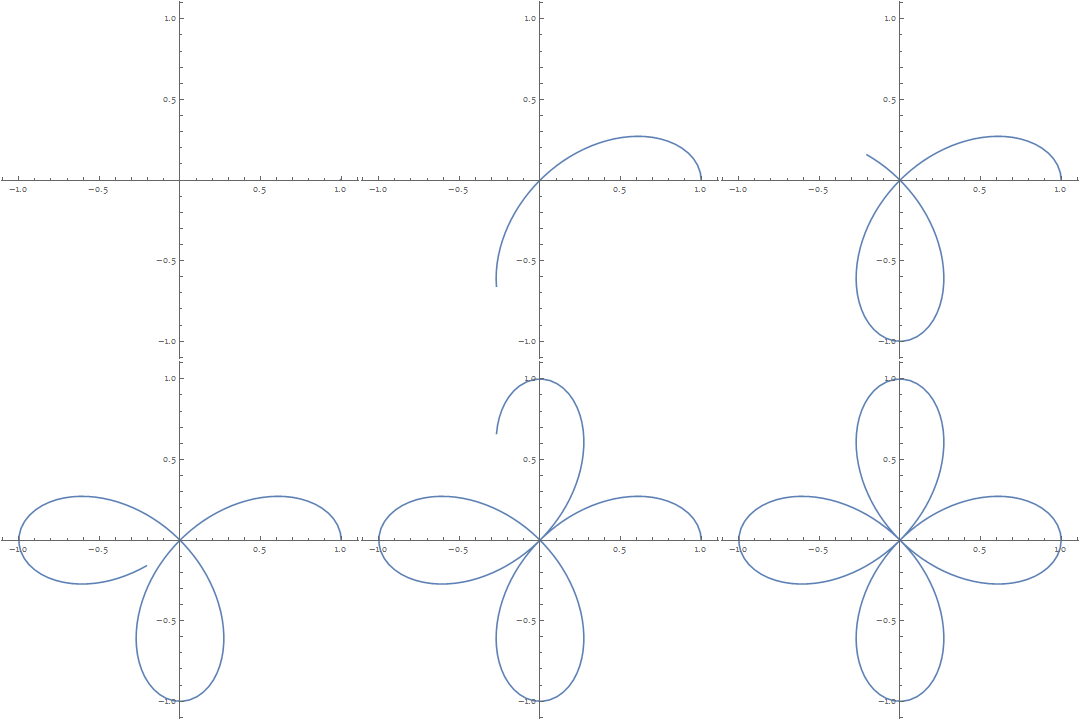
Export["FourLeaveRose.gif", frames, "GIF", "DisplayDurations" -> 1/60, AnimationRepetitions -> ∞]

Plot using equally distributed sampled points. (But yes, this effect may not be what you required.) The second benefit of my method would be only invoking Plot once, which is more efficient. Also, I would like to point out the "DisplayDurations" option of GIF export, in case it might be handy for you.
$\endgroup$
BE HAPPY!! The easiest code is:
a:=
Show[PolarPlot[Cos[2 \[Theta]], {\[Theta], 0, t}],
PlotRange -> {{-1, 1}, {-1, 1}}]
b= ParallelTable[a, {t, 0.001, 2 Pi, (2 Pi - 0.001)/100}];
Export["4-leaved-rose.gif",b ]
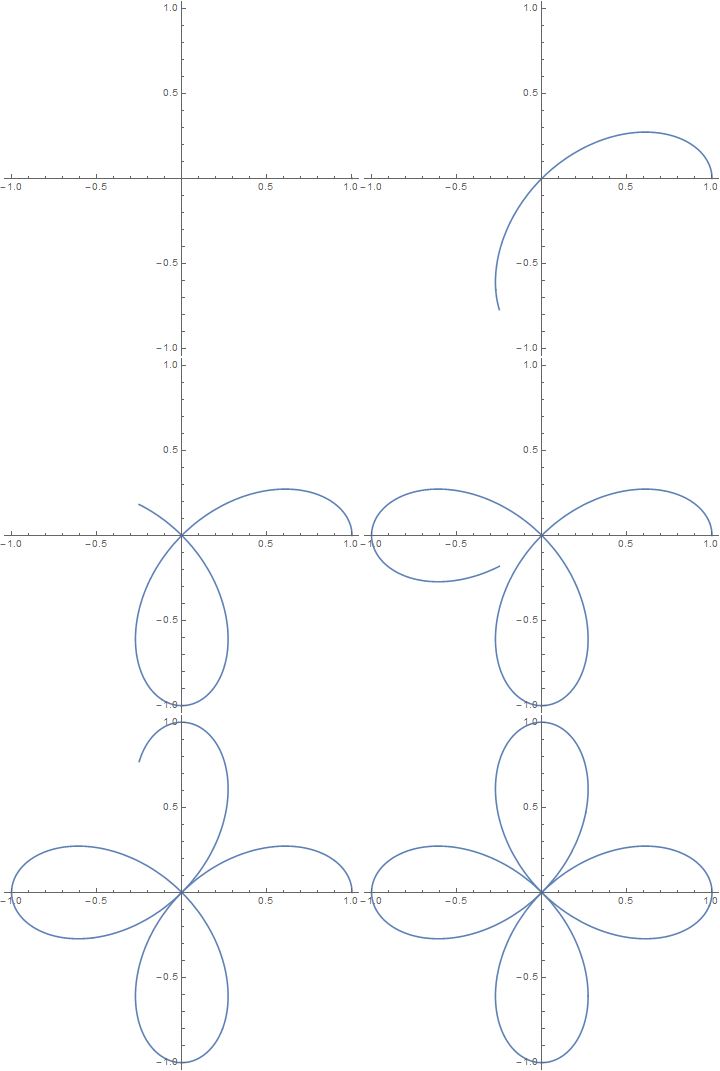
and the result is:

b = PolarPlot[Cos[2 [Theta]], {\[Theta], $MachineEpsilon, #}, PlotRange -> 1] & /@ Range[0, 2 Pi, 0.02 Pi];
$\endgroup$