7
$\begingroup$

I use the Epilog option in order to print in the vertical axes a label between 0 and 20 as follows

Plot[x^2, {x, -10, 10}, Frame -> True, Epilog -> {Text[
Style["S", FontFamily -> "Helvetica", Black, Bold, 20], {-12, 
 10}]}]
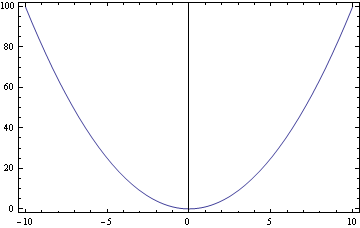
enter image description here

However, the label is not shown in the plot. I also used ImagePadding to create more white space at the left right of the plot but without result. Any suggestions how to print this label? I don't want to use custom ticks.

$\endgroup$
2
  • 1
    $\begingroup$ You are telling it to put the text at {-12,10} but you are saying the plot range should be {-10,10} ? So it will not show up. Try Plot[x^2, {x, -13, 10}, Frame -> True, Epilog -> {Text[Style["S", FontFamily -> "Helvetica", Black, Bold, 20], {-12, 10}]}] $\endgroup$
    – Nasser
    Commented Oct 10, 2014 at 6:52
  • 5
    $\begingroup$ Guys, wadr, imho, this question is not a simple mistake nor can easily be found in the documentation. It is a clearly stated question - one of the better ones in that -- and, there is no obvious solution i know of in the documentation or on this site. In fact, I have struggled with the same problem off and on until I bumped into ImagePadding/PlotRangeClipping combination -- and that only in the last two hours and thanks to this question. $\endgroup$
    – kglr
    Commented Oct 10, 2014 at 9:53

3 Answers 3

9
$\begingroup$

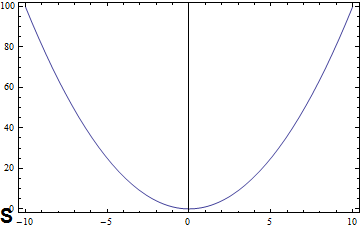
Use ImagePadding with a large enough value and set the option PlotRangeClipping to False:

Plot[x^2, {x, -10, 10}, Frame -> True,
 Epilog -> {Text[Style["S", FontFamily -> "Helvetica", Black, Bold, 20], {-12,10}]},
 ImagePadding -> 30, PlotRangeClipping -> False]

enter image description here

$\endgroup$
0
$\begingroup$

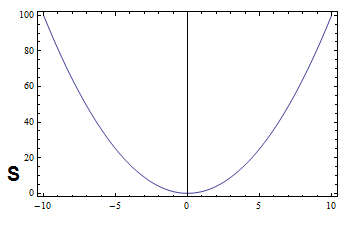
You can also consider using Overlay function with proper coodrinates.

maybe like this:

Overlay[{Plot[x^2, {x, -10, 10}, Frame -> True], 
Style["S", FontFamily -> "Helvetica", Black, Bold, 20]}, 
Alignment -> Bottom]

enter image description here

I don't know is there any method to control the relative location of objects overlayed?

$\endgroup$
1
  • $\begingroup$ Could you provide a Mathematica code example. Otherwise this is more a comment than an answer. $\endgroup$
    – Karsten7
    Commented Oct 10, 2014 at 7:42
0
$\begingroup$

The problem is that an infinite arrangement of labels exists and I doubt any degree of programming can offer all that a user can imagine. If one does not like the straightforward result of FrameLabel, as in Plot[x^2, {x, -10, 10}, Frame -> True, FrameLabel -> {None, Style["S", FontFamily -> "Helvetica", Black, Bold, 20], None, None}] (which has the label reading upward and in the middle of the frame), then I would switch to placing graphics primitives inside a Graphics command, such as line = Line@Table[{x, x^2}, {x, -10, 10, .05}]; axes = {Line[{{-10, 0}, {10, 0}}], Line[{{0, 0}, {0, 100}}]}; Graphics[{line, Thickness[.007], axes, Text[Style["S", FontFamily -> "Helvetica", Black, Bold, 20], {-12, 10}]}, AspectRatio -> 1/GoldenRatio]. This lets you get exactly what you want at the cost of additional Table loops for curves, ticks, and such.

$\endgroup$

Your Answer

By clicking “Post Your Answer”, you agree to our terms of service and acknowledge you have read our privacy policy.

Not the answer you're looking for? Browse other questions tagged or ask your own question.