Some features with V10.0.1.0 plotting under x86_64 Linux (xubuntu 12.04 & 14.04). I use ListPlot, but I also see this using other Plot functions.
Generate some data: tdata = RandomReal[{-1, 1}, {32, 2}];.
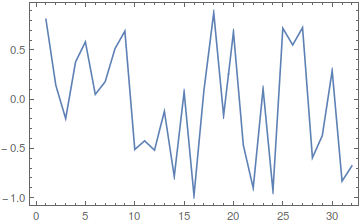
Plot the first series: ListPlot[tdata[[All, 1]], Joined -> True] to get

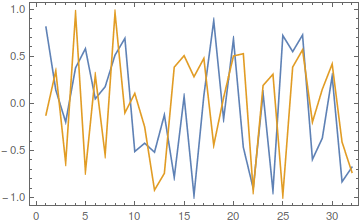
Plot both series (ListPlot[{tdata[[All, 1]], tdata[[All, 2]]}, Joined -> True]) to get

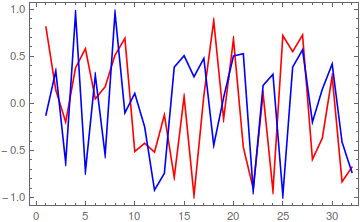
Here's where the features start. Specify styles using ListPlot[{tdata[[All, 1]], tdata[[All, 2]]}, Joined -> True, PlotStyle -> {Red, Blue}] and see

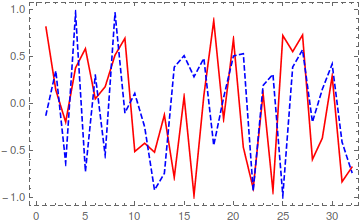
Second series dashed (ListPlot[{tdata[[All, 1]], tdata[[All, 2]]}, Joined -> True,
PlotStyle -> {Red, Directive[Blue, Dashed]}]) gives

Note the dashed Frame.
Can anybody else reproduce these effects?

Frame -> True. Have you modified the default settings? $\endgroup$