I tried applying a transformation to a rectangle:
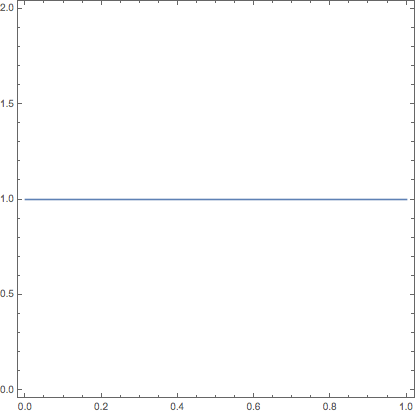
RegionPlot[TransformedRegion[Rectangle[{0, 0}, {1, 1}], {#1^(1/3) + #2, 1 + #2} &]]
giving

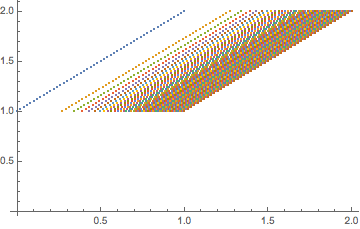
In reality, it ought to be giving a parallelogram-shaped region, based on simply transforming a bunch of points:
Table[{#1^(1/3) + #2, 1 + #2} &[k, j], {k, 0, 1, 0.02}, {j, 0, 1,
   0.02}] // ListPlot

Any idea what's going wrong here? Am I using TransformedRegion wrong?

