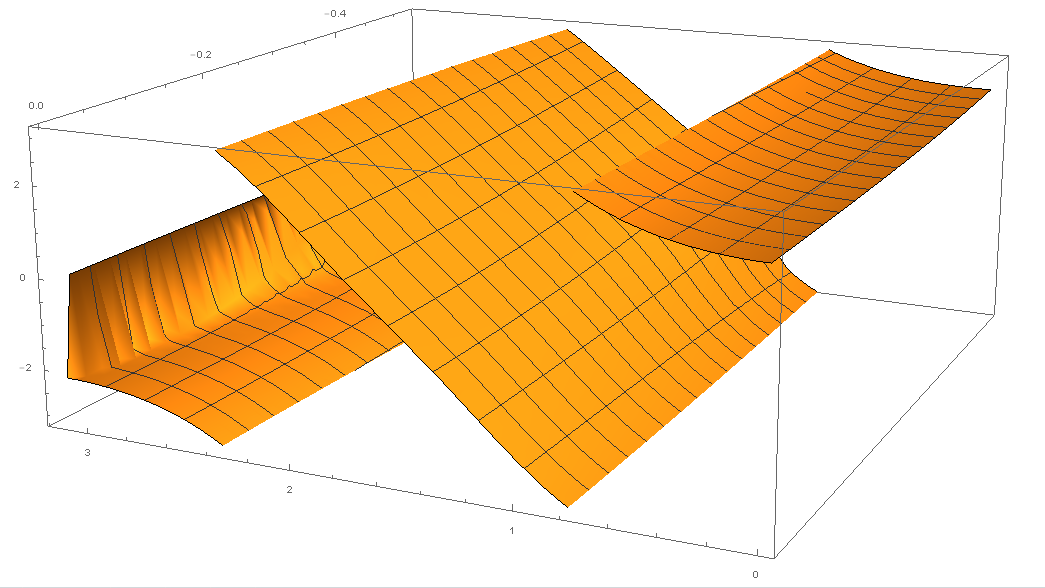
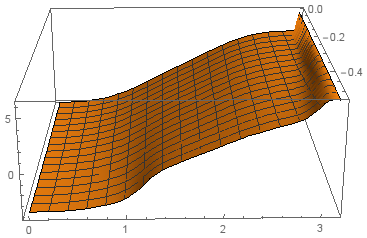
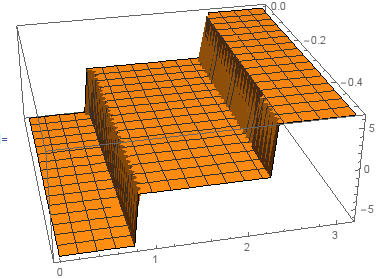
I have a problem with jumping phase plots using the Arg function in mathematica. I have looked at the other questions already asked here (e.g., continuous phase/Arg function), but am lost when dealing with a 3D plot. Could anybody help me?
So this is the code:
beta[al_, al2_] := (al^2 + al2^2)^(1/2);
Mx[alpha_, ora_] := alpha*ora/beta[alpha, ora]^2*(4*Sin[beta[alpha, ora]]^2*Cos[beta[alpha, ora]]) - alpha*Sin[beta[alpha, ora]]/beta[alpha, ora]^3*(alpha^2*Cos[2*beta[alpha, ora]] + ora^2);
My[alpha_, ora_] := 2*alpha*Sin[beta[alpha, ora]]/beta[alpha, ora]^3*(ora^2*Cos[2*beta[alpha, ora]] + alpha^2*Cos[beta[alpha, ora]]) + alpha*ora/beta[alpha, ora]^4*(1 - Cos[beta[alpha, ora]])*(alpha^2*Cos[2*beta[alpha, ora]] + ora^2);
Mx2[alpha_, ora_] := -alpha*ora/beta[alpha, ora]^2*(4*Sin[beta[alpha, ora]]^2*Cos[beta[alpha, ora]]) - alpha*Sin[beta[alpha, ora]]/beta[alpha, ora]^3*(alpha^2*Cos[2*beta[alpha, ora]] + ora^2);
My2[alpha_, ora_] := -2*alpha*Sin[beta[alpha, ora]]/beta[alpha, ora]^3*(ora^2*Cos[2*beta[alpha, ora]] + alpha^2*Cos[beta[alpha, ora]]) + alpha*ora/beta[alpha, ora]^4*(1 - Cos[beta[alpha, ora]])*(alpha^2*Cos[2*beta[alpha, ora]] + ora^2);
Mxy[alpha_, ora_] := Mx[alpha, ora] + I*My[alpha, ora];
Mxy2[alpha_, ora_] := Mx2[alpha, ora] + I*My2[alpha, ora];
phi[alpha_, ora_] := Arg[Mxy2[alpha, ora]/Mxy[alpha, ora]];

Plot3D[phi[a, b], {a, 0, Pi}, {b, 0, -Pi/6}]
Then as expected the function is only defined in the range of [-Pi, Pi] due to the Arg function used is phi, therefore there are two jumps in this case. This is what I get

How can I make it continous from -2 Pi to 2 Pi on the z-Axis in this 3D plot. Any ideas?


