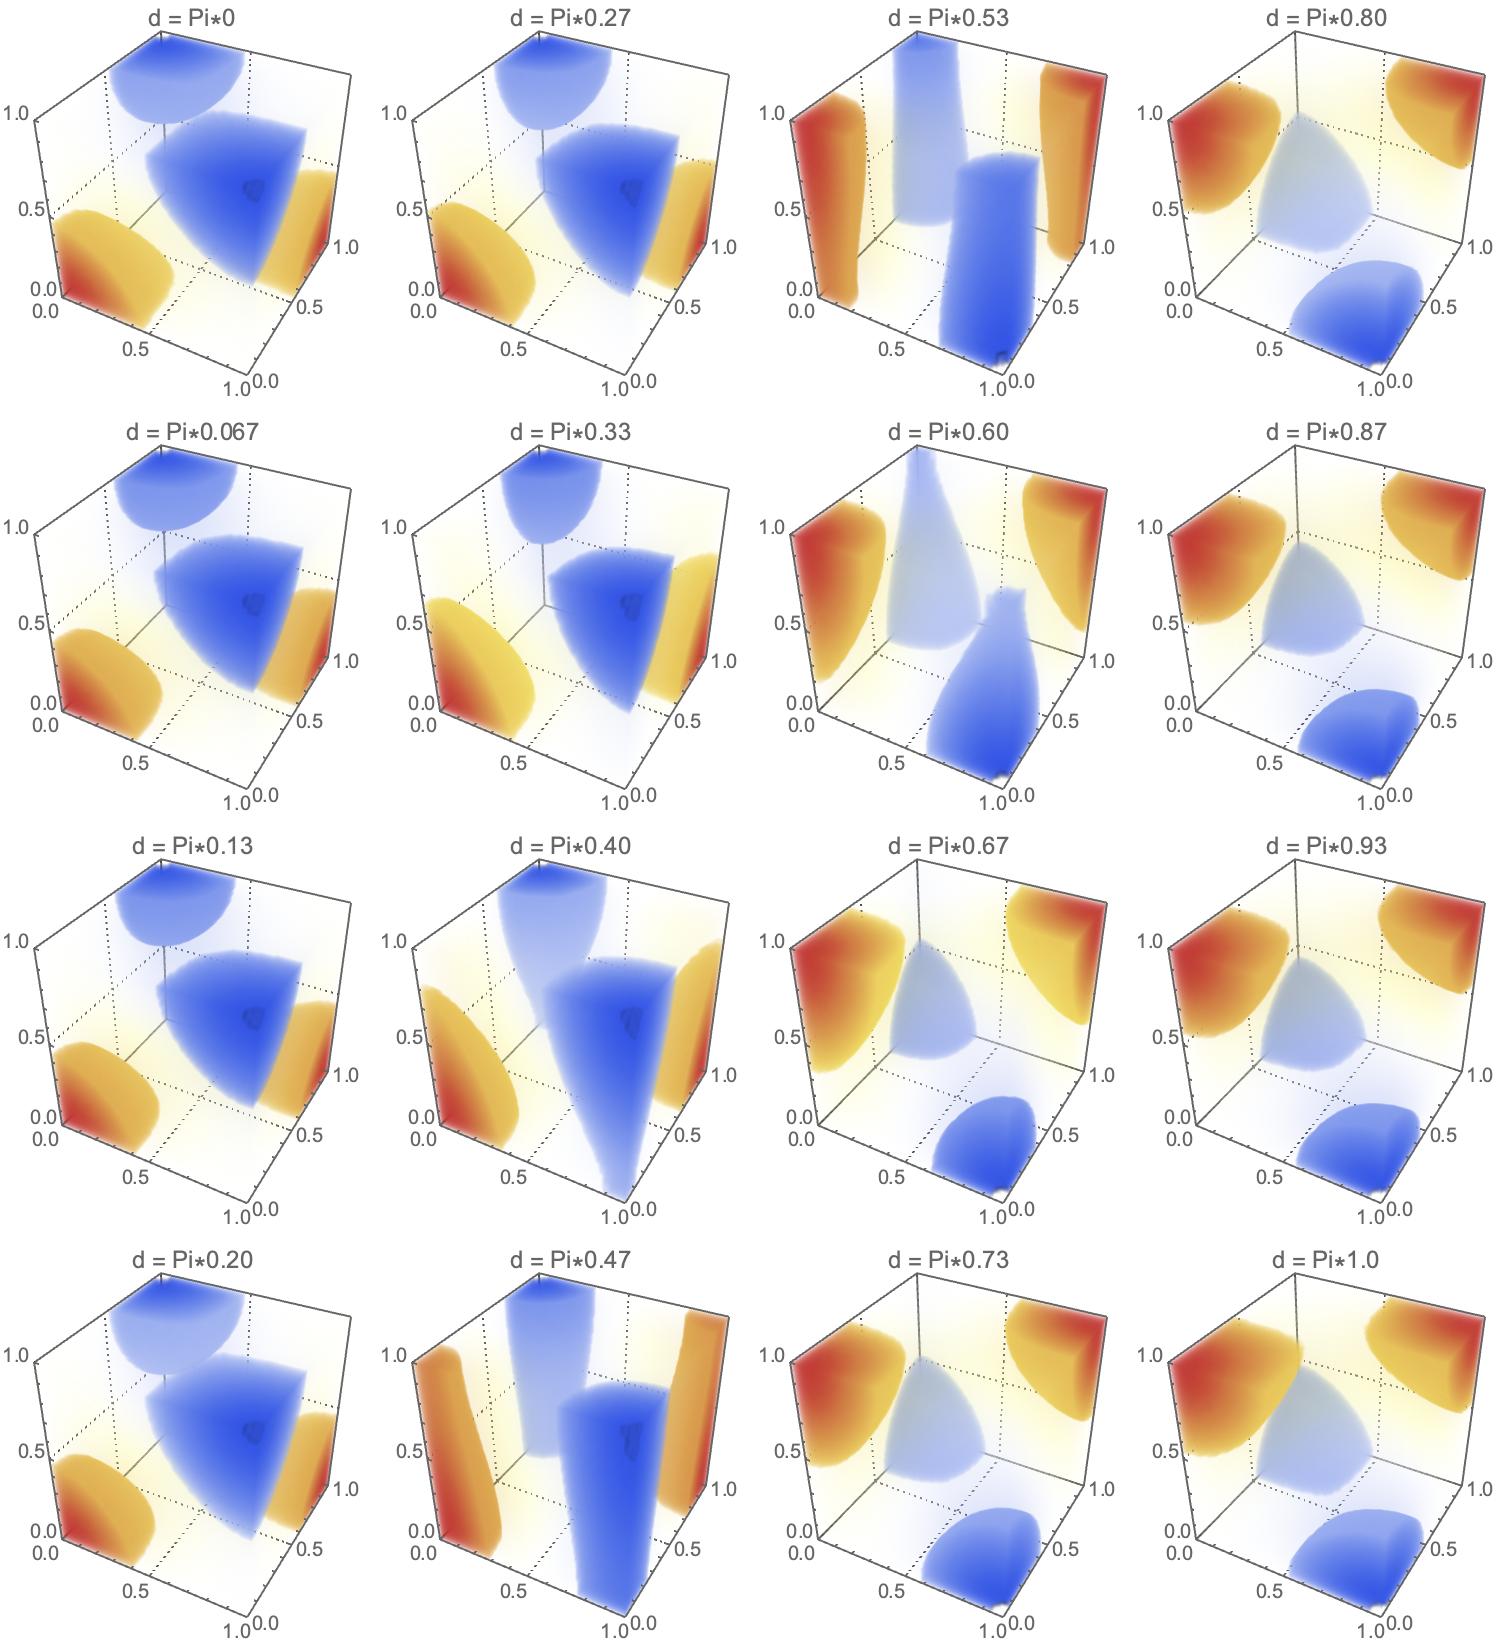
Everywhere below I use a rescaled by Pi version with variable ranges $[0,1]$ -- it easier to understand it on the plots:
Cos[Pi a]Cos[Pi b]+Cos[Pi g]Cos[Pi d]
3D + color + tabulation

You can make usage of DensityPlot3D that gives you 4D plotting (3 axes and 4th color variable) and then run remaining 5th variable through a range of values. This code will give you the top image (explore options of DensityPlot3D to adapt to your needs):
Multicolumn[
Table[
DensityPlot3D[
    Cos[Pi a]Cos[Pi b]+Cos[Pi g]Cos[Pi d],
    {a,0,1},{b,0,1},{g,0,1},
    PlotLabel->"d = Pi*"<>ToString[N[d,2]],
    ColorFunction->"TemperatureMap",
    PlotTheme->"Detailed",
    PlotLegends->None],
{d,0,1,1/15}]
,4]
3D + color + tabulation

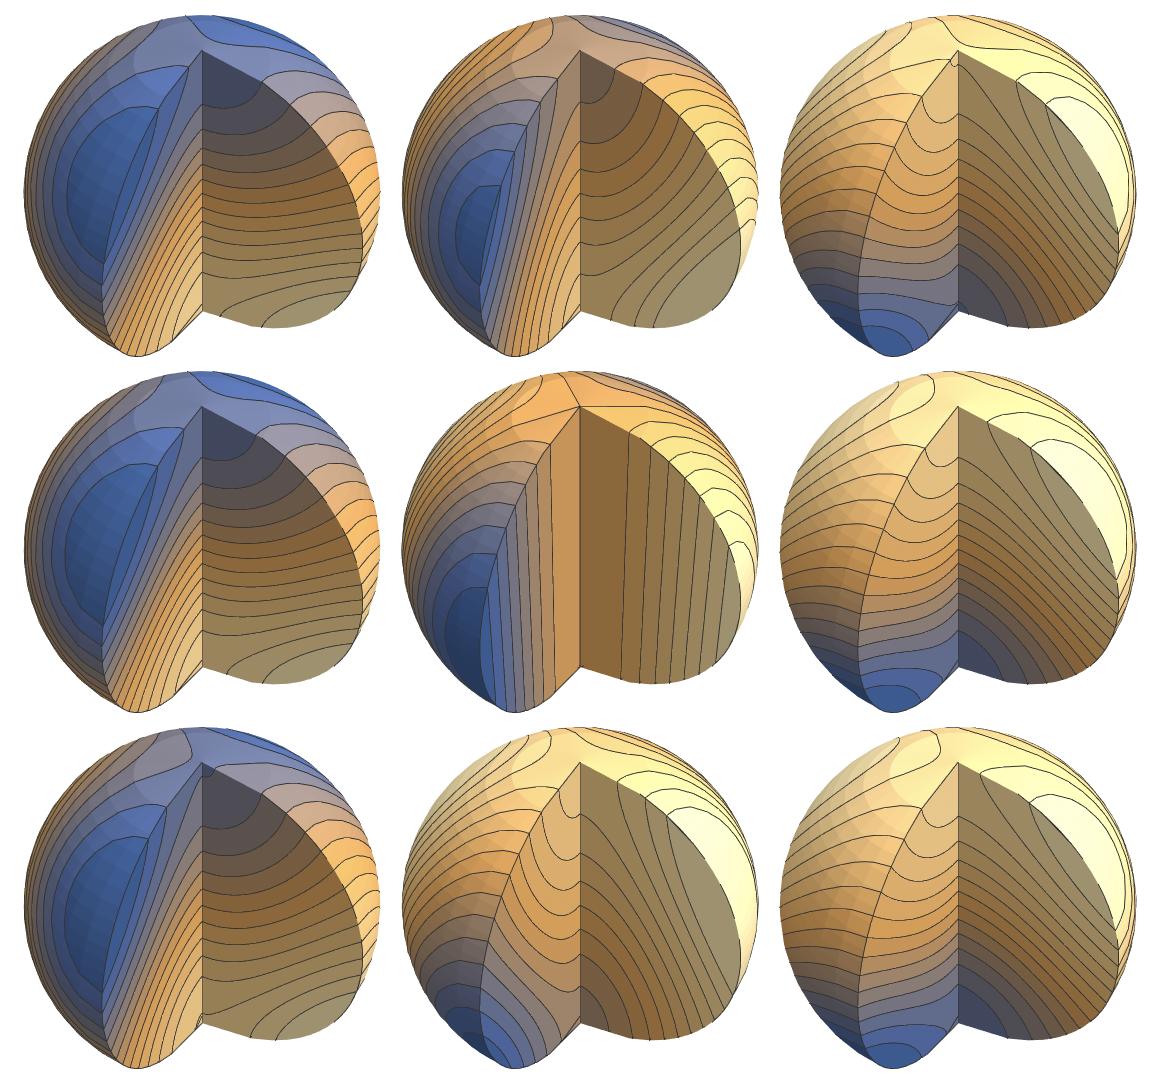
This one is a bit unorthodox, but I just love the look of it.
Multicolumn[
Table[
    SliceContourPlot3D
        [Cos[Pi a]Cos[Pi b]+Cos[Pi g]Cos[Pi d],
        {"CenterCutSphere",Pi/2,0},
        {a,0,1},{b,0,1},{g,0,1},
        ViewPoint->{2.4,-0.6,2.3},
        Boxed->False,
        Axes->False,
        Contours->15,
        Method->{"ShrinkWrap"->True}],
{d,0,1,1/8}],
4]
3D + color + tabulation

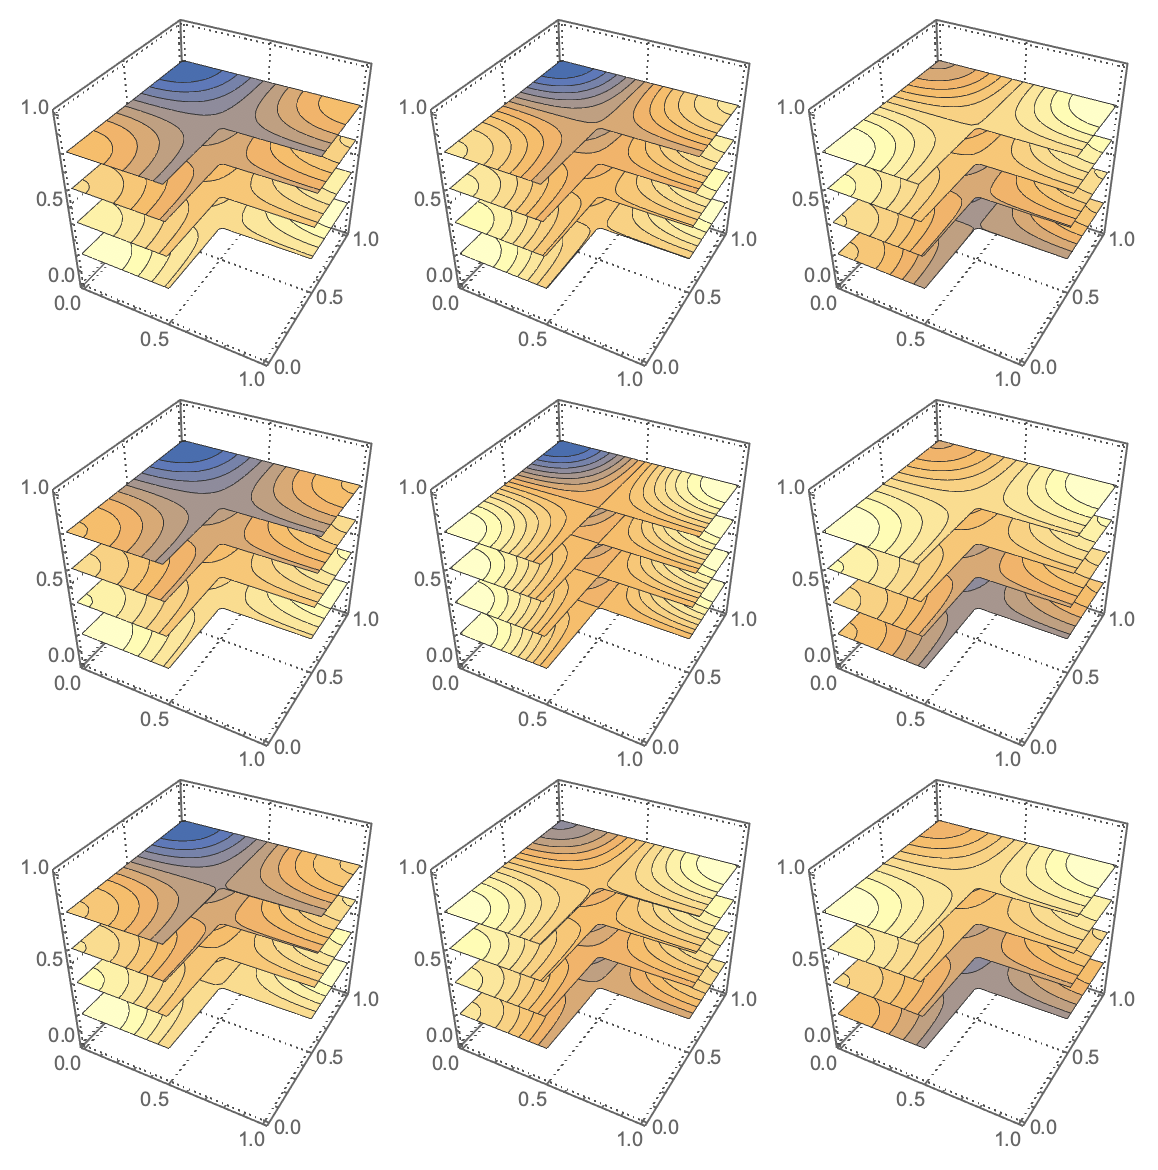
One more take on this...
Multicolumn[
Table[
    SliceContourPlot3D
        [Cos[Pi a]Cos[Pi b]+Cos[Pi g]Cos[Pi d],
        {"ZStackedPlanes",4},
        {a,0,1},{b,0,1},{g,0,1},
        RegionFunction->Function[{x,y,z},x<1/2||y>1/2],
        Contours->15,
        PlotTheme->"Detailed",
        PlotLegends->False,
        Method->{"ShrinkWrap"->True}],
{d,0,1,1/8}],
4]
3D + multi-surface + animation

Alternatively you can use Plot3D surface for 3D, table of surfaces for the 4th, and animation for the 5th parameter. Here is the code for the animation above:
Manipulate[
    Plot3D[
    Table[Cos[Pi a]Cos[Pi b]+Cos[Pi g]Cos[Pi d],{b,0,1,1/2}],
    {a,0,1},{g,0,1},
    PlotPoints->15,
    SphericalRegion->True,
    ImageSize->{400,400},
    Mesh->10,
    MeshStyle->Opacity[.5],
    BoxRatios->1,
    ColorFunction->"Rainbow",
    AxesLabel->{a,g,f}],
{d,0,1}]


