31
$\begingroup$

A hypergraph is a generalization of a graph, in which an edge can connect more than two vertices. Thus you can think of an edge in an hypergraph as a subset of nodes.

Since version 8, Mathematica has supported the plotting of graphs, as well as graph algorithms.

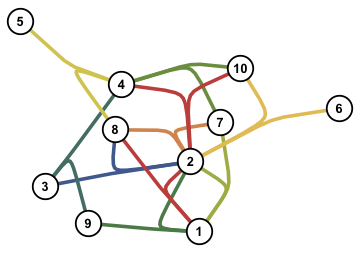
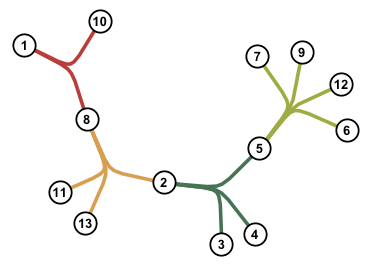
Is there a way to plot hypergraphs on Mathematica? I know there are ways in which an hypergraph can be represented as a graph, or a matrix. But what I want is a method that allows me to plot the hypergraph directly, where edges that connect multiple vertices are drawn as branching lines between those vertices (for example, think of a reaction network). See, for example, the first image in this question.

$\endgroup$

5 Answers 5

29
$\begingroup$

Something similar to one in the Op's link:

hyperPlot[sets_, blayout_: "SpringEmbedding"] :=

 Block[{l, esym, eset, vset, g, em, rules, edges, vcircle},
  l = Length[sets];
  esym = Table[Unique["e"], {l}];
  eset = Flatten[Table[Thread[sets[[i]] <-> esym[[i]]], {i, l}]];
  vset = Union[Join @@ sets];
  g = Graph[vset, eset, GraphLayout -> blayout];
  em = GraphEmbedding[g];
  rules = Dispatch[Thread[VertexList[g] -> em]];
  edges = 
   Table[{ColorData["DarkRainbow"][i/l], 
     Arrow[BSplineCurve[{sets[[i, 1]], esym[[i]], #} /. rules, 
         SplineWeights -> {1, 6, 1}], {.2, .2}] & /@ 
      Rest[sets[[i]]]}, {i, l}];
  vcircle = 
   With[{c = # /. rules}, {Text[Style[#, Bold, 13], c], 
       Circle[c, .2]}] & /@ vset;
  Graphics[{{Thickness[.01], Arrowheads[0], edges}, Thickness[.005], 
    vcircle}]
  ]

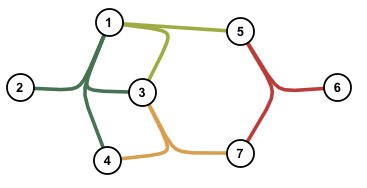
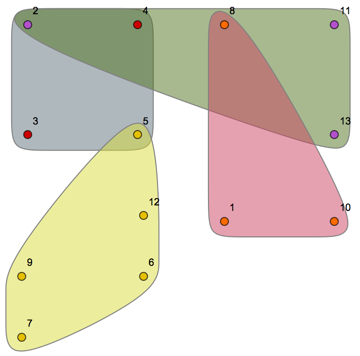
basically, I added dummy vertex to each sets to define edges and construct graph. Using embedding information, I will draw graph and edges. It's not perfect, but another possibility. Also you could draw directed hyper graph..

vs = {{2, 3, 4, 5}, {5, 9, 12, 6, 7}, {8, 2, 11, 13}, {1, 8, 10}};
hyperPlot[vs]

enter image description here

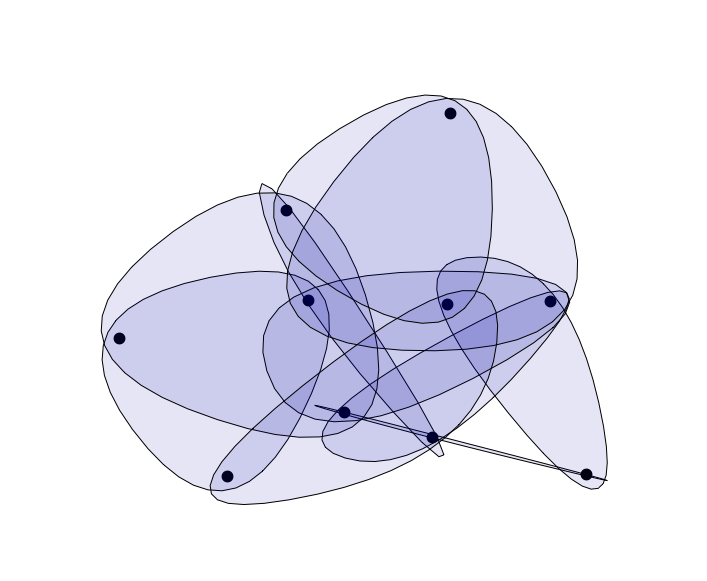
vs = RandomSample[Subsets[Range[10], {3}], 10];
hyperPlot[vs, "SpringElectricalEmbedding"]

enter image description here

vs = {{1, 2, 3, 4}, {1, 3, 5}, {3, 4, 7}, {5, 6, 7}};
hyperPlot[vs]

enter image description here

$\endgroup$
6
  • $\begingroup$ This would make a nice function repository item. The current HypergraphPlot (which is very similar to Vitaliy's) is not really usable in practice (too often a region includes vertices that it should not). Your version is much more practical. $\endgroup$
    – Szabolcs
    Commented Oct 18, 2019 at 15:36
  • 1
    $\begingroup$ @Szabolcs it's in function repository now. $\endgroup$
    – halmir
    Commented Nov 18, 2019 at 14:09
  • $\begingroup$ @halmir I'd like to use this but in my application, but I need to specify vertex positions. By editing this and passing in a value for the em variable it seems I need to provide the edge position data in addition. Is there a way to modify so we only specify vertex positions? Also, can you please give a link to the function repo where this is located? $\endgroup$
    – nasosev
    Commented Sep 6, 2022 at 1:03
  • 1
    $\begingroup$ @nasosev I submitted new version to support VertexCoordinates and here's the l ink: resources.wolframcloud.com/FunctionRepository/resources/… $\endgroup$
    – halmir
    Commented Sep 6, 2022 at 16:21
  • 1
    $\begingroup$ @nasosev updated is not online yet.. it's reviewing now $\endgroup$
    – halmir
    Commented Sep 7, 2022 at 14:22
20
$\begingroup$

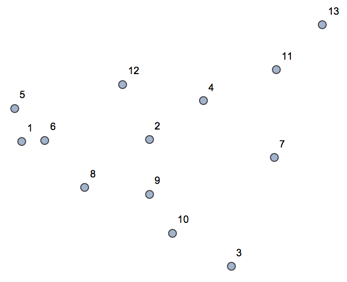
Here is a different take on @Szabolcs idea. If a general grouping will do CommunityGraphPlot can be used. Define a 13-vertex graph with no simple (as opposed to hyper) edges:

g = Graph[Range[13], {}, 
     VertexCoordinates -> RandomReal[1, {13, 2}], VertexLabels -> "Name"]

enter image description here

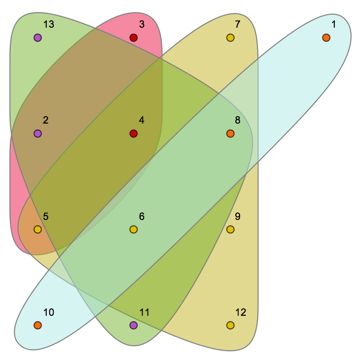
Explicetely define hyper-edges as groups of vertices they connect:

CommunityGraphPlot[g,
 {{2, 3, 4, 5}, {5, 9, 12, 6, 7}, {8, 2, 11, 13}, {1, 8, 10}},
 CommunityRegionStyle -> RandomColor[RGBColor[_, _, _, .5], 4]]

enter image description here

Use Method option for different layouts:

CommunityGraphPlot[g,
 {{2, 3, 4, 5}, {5, 9, 12, 6, 7}, {8, 2, 11, 13}, {1, 8, 10}},
 CommunityRegionStyle -> RandomColor[RGBColor[_, _, _, .5], 4], Method -> "Hierarchical"]

enter image description here

$\endgroup$
5
  • 2
    $\begingroup$ This is much better than mine. I only did it for 3-hypergraphs, this is probably more general. Is there a guarantee that a region will never contain a node that should not be part of it? This is actually a non-trivial layout problem that I didn't know how to solve for the general case. If CommunityGraphPlot guarantees this, then I want to delete my answer. $\endgroup$
    – Szabolcs
    Commented Sep 2, 2014 at 22:11
  • 1
    $\begingroup$ @Szabolcs I do not think there is a guarantee. I can ask for certainty, but just by poking around I've seen this violated. $\endgroup$ Commented Sep 2, 2014 at 22:35
  • $\begingroup$ @Szabolcs ...but coloring of vertices helps a bit. $\endgroup$ Commented Sep 2, 2014 at 22:41
  • 1
    $\begingroup$ If the $n$ vertices are arranged on a regular $n$-gon (or they're just put on a circle), then it is automatically guaranteed that a polygon made of a subset of the vertices won't contain anything but that subset. This at least shows that this is possible. Putting the vertices on a circle may not be a very efficient arrangement though. I think CommunityGraphPlot doesn't support CircularEmbedding, right? $\endgroup$
    – Szabolcs
    Commented Sep 3, 2014 at 19:06
  • $\begingroup$ @Szabolcs I did not find an easy way to do this. $\endgroup$ Commented Sep 4, 2014 at 13:13
8
$\begingroup$

This is just a rough proof-of-concept that needs additional work for real applications.

For 3-hypergraphs, you could simply surround each triple with a rounded polygon. I didn't implement rounded polygons now (which would look better), I just used B-splines, but these are a but ugly.

hg = RandomSample[Subsets[Range[10], {3}], 10]
(* {{2, 5, 6}, {3, 5, 9}, {2, 4, 10}, {2, 6, 9}, {1, 4, 7}, {4, 
  6, 9}, {1, 6, 10}, {4, 8, 9}, {2, 3, 7}, {3, 8, 10}} *)

cg[n_] := Graph[n, UndirectedEdge @@@ Subsets[n, {2}]]

g = GraphUnion @@ (cg /@ hg);

pos = GraphEmbedding[g];

dt = Dispatch@Thread[VertexList[g] -> pos];

expand[pts_] := 
 With[{c = Mean[pts]}, # + c & /@ (1.8 (# - c & /@ pts))]

Graphics[{Disk[#, 0.03] & /@ pos, 
  FaceForm@Directive[Darker@Blue, Opacity[0.1]], EdgeForm[Black], 
  FilledCurve@BSplineCurve[#, SplineClosed -> True] & /@ 
   expand /@ (hg /. dt)}]

Mathematica graphics

$\endgroup$
3
  • $\begingroup$ I don't know anything about hypregs. Just a question: Are they always undirected? $\endgroup$ Commented Sep 2, 2014 at 21:17
  • $\begingroup$ Nice visual @belisarius! What about n-edges? Found this on the demonstrations site: demonstrations.wolfram.com/ThreeUniformHypergraphs $\endgroup$
    – user5601
    Commented Sep 2, 2014 at 21:38
  • $\begingroup$ @belisarius, oriented hyerpgraphs have been studied recently, see the work by Reff and Rusnak, esp the latter's thesis in 2010. $\endgroup$ Commented Sep 2, 2014 at 21:41
5
$\begingroup$

For generating large ones (without many hyperedge overlaps) WolframModelPlot works well:

ResourceFunction[
 "WolframModelPlot"][{{1, 2, 3}, {3, 4, 5}, {5, 6, 7, 1}}]

enter image description here

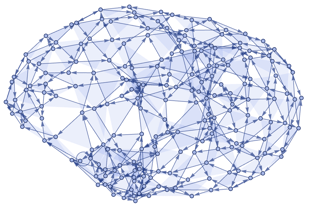
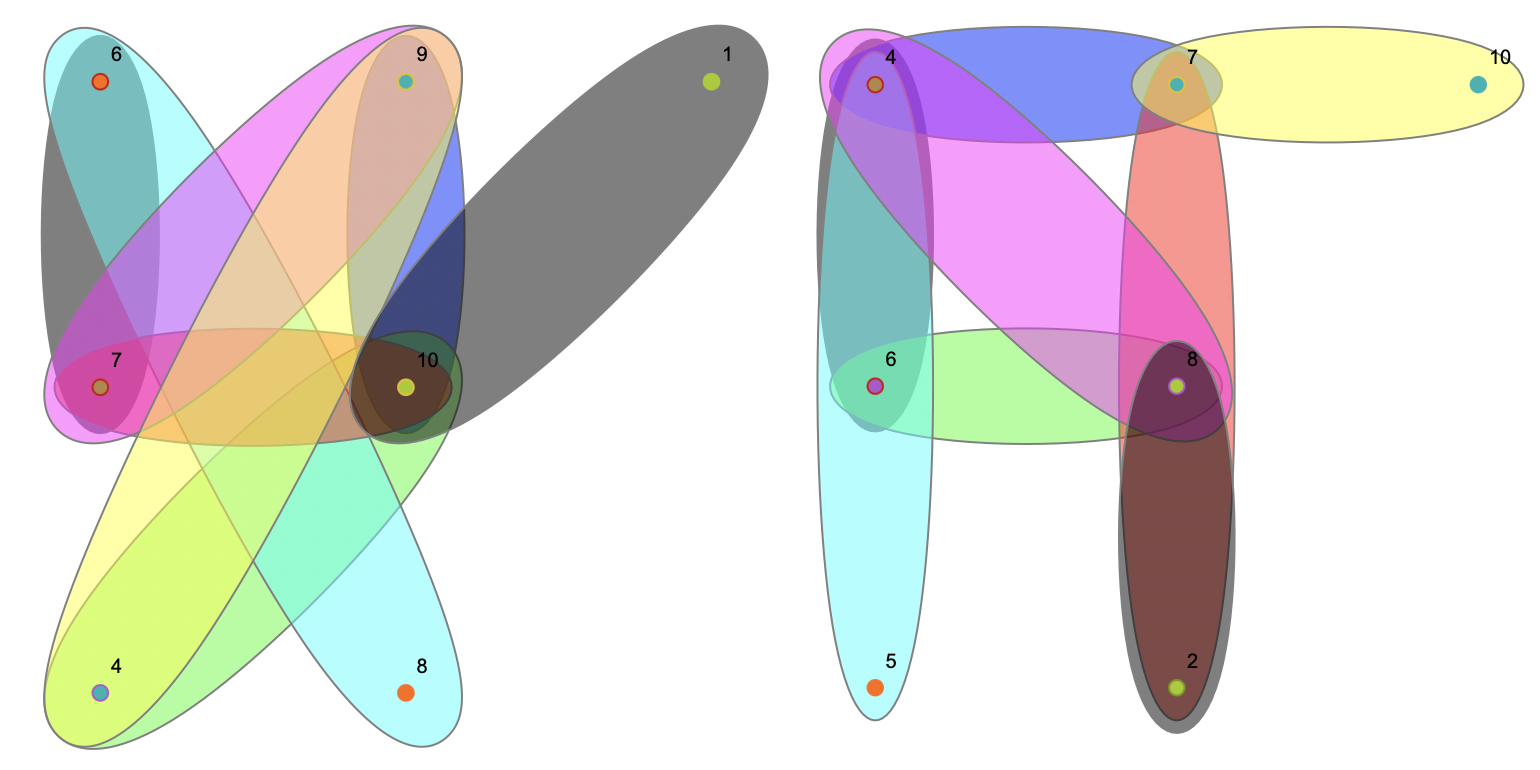
There is also a Hypergraph paclet in development with some flexibale styles, which tries to make hypergraphs behave like native objects, similar to Graphs:

Table[PacletSymbol["WolframInstitute/Hypergraph", "RandomHypergraph"][
  10, {{3, 1}, {5, 2}, {4, 3}}], 3]

enter image description here

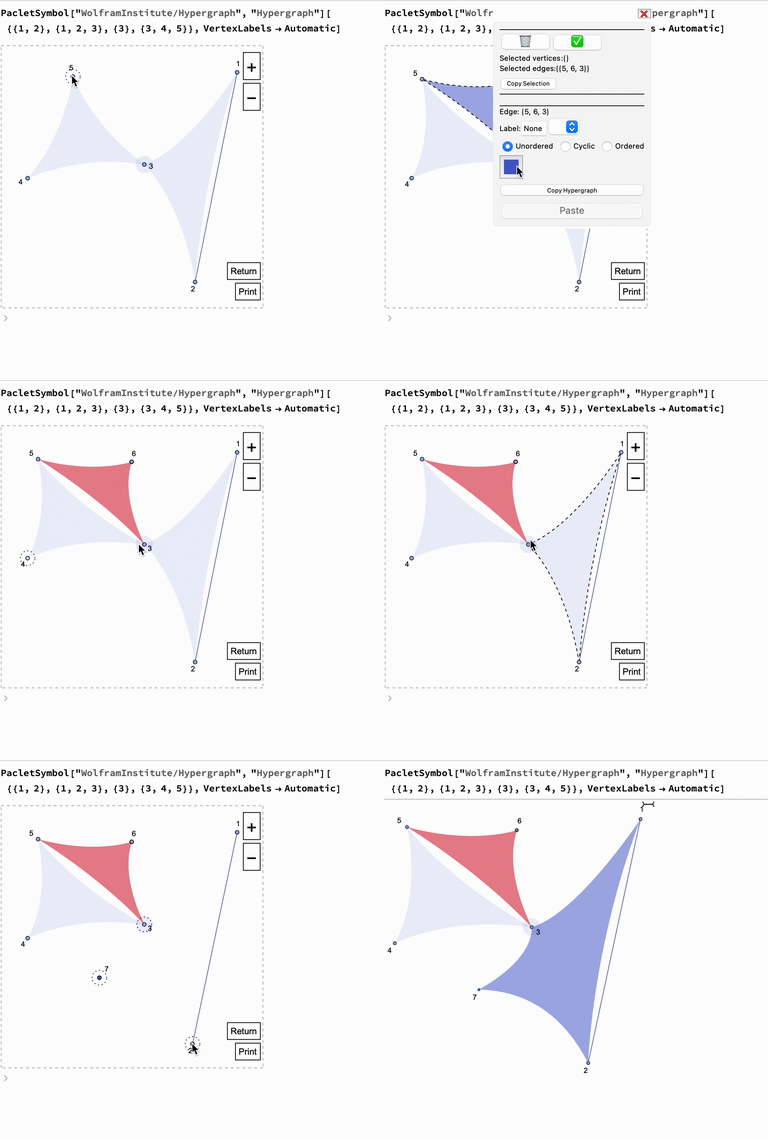
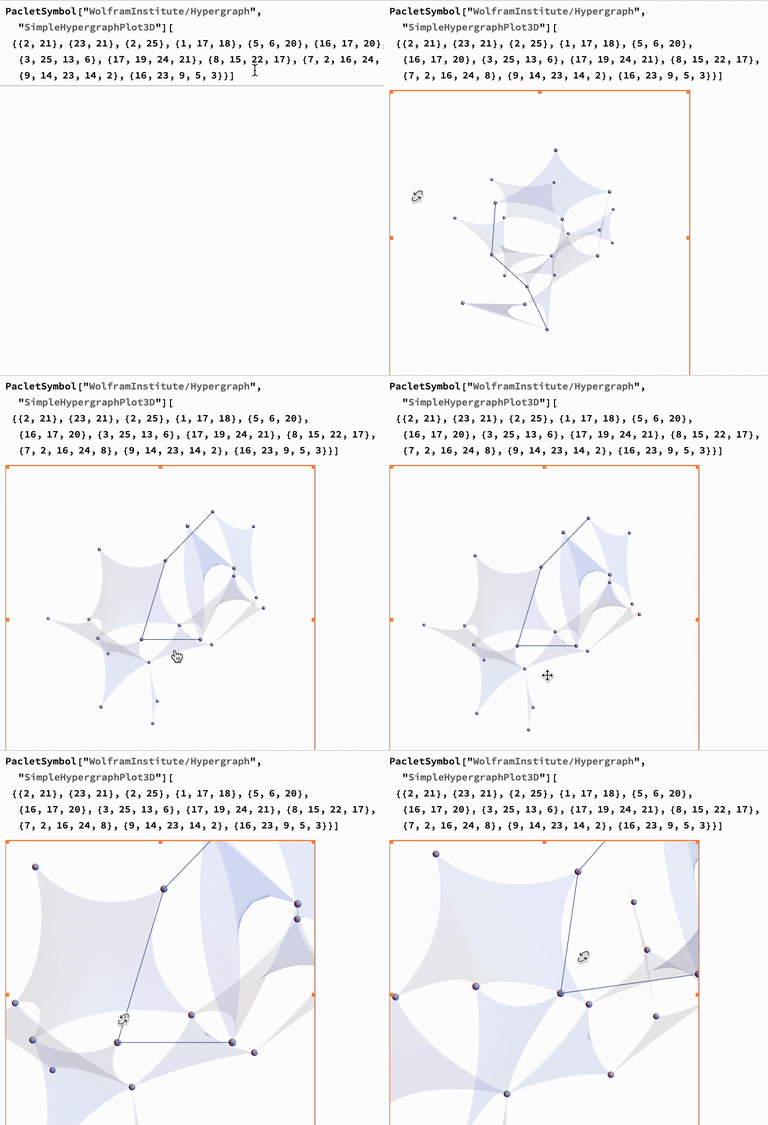
It also has a dynamic widget for manipulating hypergraphs:

enter image description here

And 3D hypergraphs:

enter image description here

$\endgroup$
4
$\begingroup$
ResourceFunction["RandomHypergraph"][{10, {8, 2}}]

ResourceFunction["SimpleHypergraphPlot"][%] 

enter image description here

$\endgroup$

Your Answer

By clicking “Post Your Answer”, you agree to our terms of service and acknowledge you have read our privacy policy.

Not the answer you're looking for? Browse other questions tagged or ask your own question.