I'm delivering an upcoming course on Data Science with the programming/analysis done predominantly in the Wolfram Language. I created the following table to leverage students' familiarity with Lists by way of introducing Associations by way of introducing Datasets. Juxtaposing the various invocations one can't help but be struck with the foresight or "naturalness" of the original language design and subsequent integrations - (IMO an extraterrestrial would be hard-pressed to predict the chronology of sequentially added features, and in particular, to note that all three didn't emerge simultaneously).
My sense is that programming expertise in the Wolfram Language starts with an awareness of its existing (or "likely") functionality followed by inculcating and memorising its basic functional forms. While the documentation is essential for understanding all the details and an overall coherency, for quick reference/comparison/contrast, I think cheatsheets could be more commonly deployed (with no doubt improved visual design - the code follows which could potentially be improved/combined with other users' cheatsheets into a larger, more powerful "Demonstration"?)
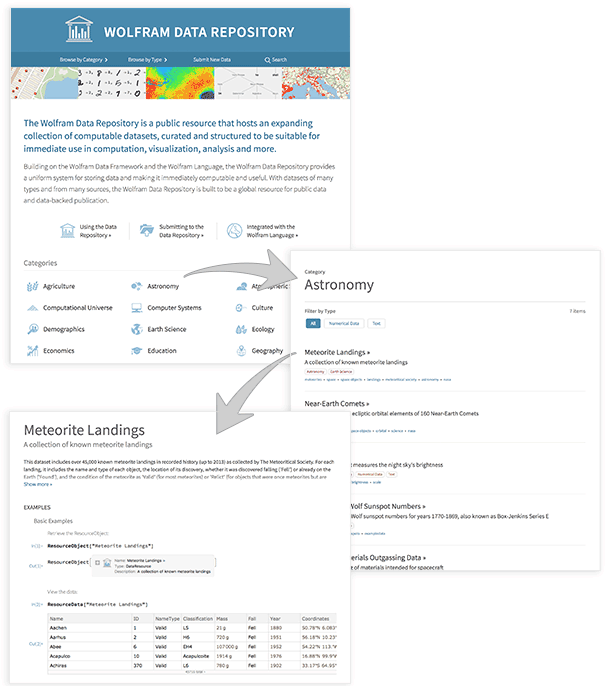
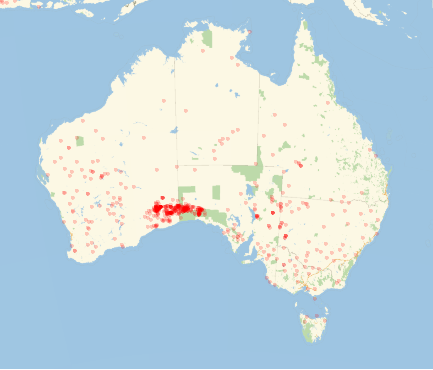
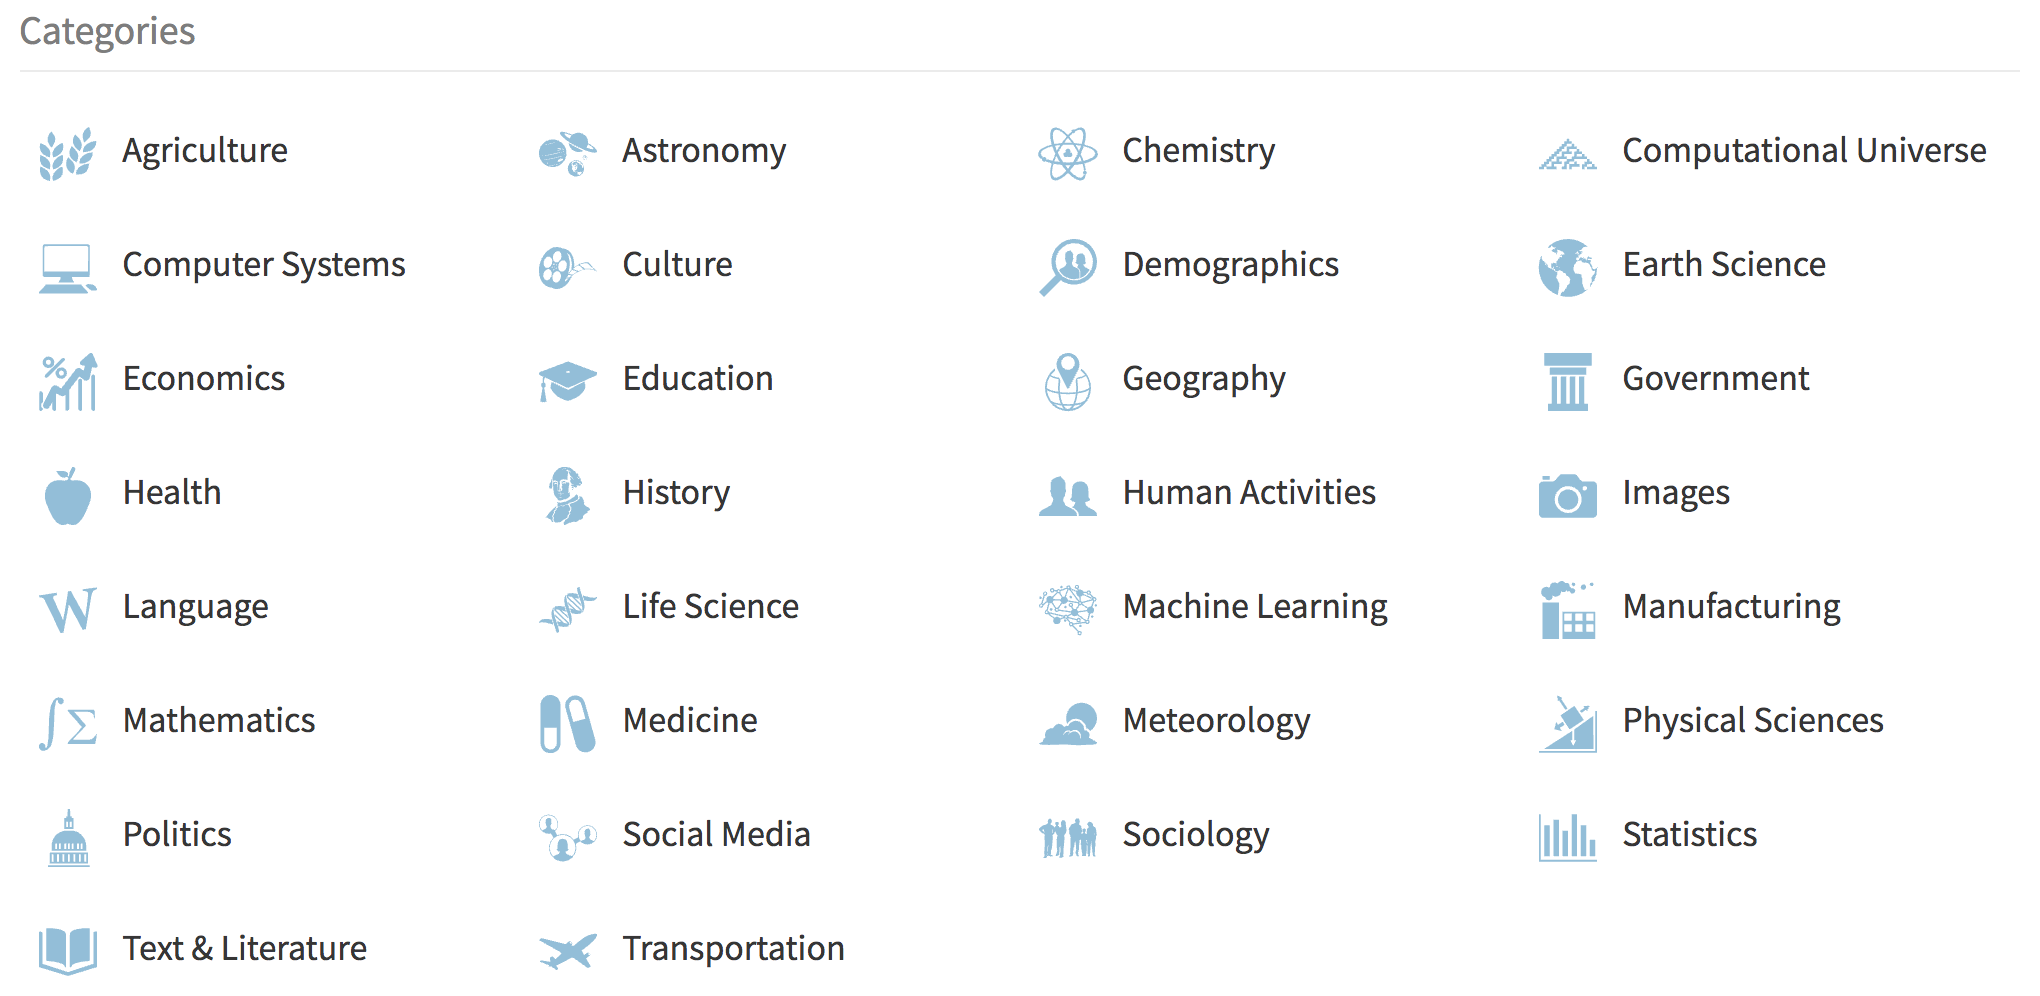
At any rate, while an introduction involves becoming familiar with the basic syntax and manipulating structured datasets, the next stage involves applying these to some real-life examples. While there are good texts/datasets available (e.g. Luís Torgo's Data Mining with R: Learning with Case Studies) I'm wondering if anyone has found useful, available datasets from a variety of contexts (health, business, economics, ecology, physics, learning analytics) that might be particularly suitable for showcasing some of the benefits of data science in the Wolfram Language (this might be due to their size, unusual analysis, parallelizability, integration with curated data etc).

SetAttributes[{IOCells, DefCells, InsertIOCells, InsertDefCells},
  HoldAll];


DefCells[Set[lhs_, rhs_]] := Row[{
    ExpressionCell[Defer@lhs, "Input", ShowStringCharacters -> True,
     FontSize -> 16],
    ExpressionCell[" = ", ShowStringCharacters -> False,
     FontSize -> 16],
    ExpressionCell[lhs = rhs, "Input", ShowStringCharacters -> True,
     FontSize -> 16]}];

(* Need to split in this way since a Defer wrapper seems to produce \
unexpected formatting - compare:
ExpressionCell[Defer[lhs=<|"a"\[Rule]8,"b"\[Rule]9,"c"\[Rule]10|>],\
"Input"]
 ExpressionCell[Defer[lhs=\[LeftAngleBracket]"a"\[Rule]8,"b"\[Rule]9,\
"c"\[Rule]10\[RightAngleBracket]],"Input"]
 *)

DefCells[R : Set[dataset, Dataset[{_}]]] := (R; Row[{
     ExpressionCell[Defer@dataset, "Input",
      ShowStringCharacters -> True, FontSize -> 16],
     ExpressionCell[" = ", ShowStringCharacters -> False,
      FontSize -> 16],
     ExpressionCell["Dataset"[HoldForm[{assoc}]], "Input",
      ShowStringCharacters -> False, FontSize -> 16]}]);

IOCells[expr_] /; !
    FreeQ[Hold@expr,
     Histogram | ListPlot | ListLinePlot | BarChart3D | BarChart |
      PieChart | SmoothHistogram] := Grid[{
    {ExpressionCell[Defer@expr, "Input",
      ShowStringCharacters -> True]},
    {ExpressionCell[expr, "Output", Magnification -> 0.41]}
    }, Frame -> True, Alignment -> Left,
   Background -> {None, {1 -> GrayLevel[.9], 2 -> White}}];


IOCells[expr_] := Grid[{
    {ExpressionCell[Defer@expr, "Input",
      ShowStringCharacters -> True]},
    {ExpressionCell[expr, "Output"]}
    }, Frame -> True, Alignment -> Left,
   Background -> {None, {1 -> GrayLevel[.9], 2 -> White}}];

(* For the same reason above need a specific definition when <|  |> \
notation is in input *)

IOCells[R : KeySelect[assoc_, assoc2_]] := With[
   {t = ToExpression@ToBoxes[assoc2]}, Grid[{
     {ExpressionCell[HoldForm@KeySelect[assoc, t], "Input",
       ShowStringCharacters -> True]},
     {ExpressionCell[ReleaseHold@R, "Output"]}
     }, Frame -> True, Alignment -> Left,
    Background -> {None, {1 -> GrayLevel[.9], 2 -> White}}]];

IOCells[R : Dataset[expr_][op_]] := Grid[{
    {ExpressionCell["Dataset"[HoldForm@assoc][op], "Input",
      ShowStringCharacters -> False]},
    {ExpressionCell[ReleaseHold@R, "Output"]}
    }, Frame -> True, Alignment -> Left,
   Background -> {None, {1 -> GrayLevel[.9], 2 -> White}}];

(* Since Dataset outputs as grid in the input - means copying \
expression from the grid and evaluating won't work *)


InsertDefCells[defs_List] :=
  ReleaseHold@With[{t = Hold@defs}, Map[DefCells, t, {2}]];
InsertIOCells[exprLs_] :=
  Sequence @@
   Map[Row,
    ReleaseHold@With[{t = Hold@exprLs}, Map[IOCells, t, {4}]], {2}];

ColumnHeadStyle[cheads_List] :=
  ExpressionCell[#, Style[#, {Bold, 18}],
     ShowStringCharacters -> False] & /@ cheads;


Block[{$PlotTheme = "Minimal"}, Grid[{
   {"List", "Association", "Dataset"} // ColumnHeadStyle,
   {ls = {7, 8, 9}, assoc = <| "a" -> 7, b -> 8, "c" -> 9 |>,
     dataset = Dataset[{assoc}]} // InsertDefCells,
   {
     {{ls[[All]]}, {Values[assoc], Keys[assoc], Normal[assoc],
       Lookup[assoc, "b", "No-b"]}, {dataset[1, Values],
       dataset[1, Keys]}},
     {{(Query@1)[ls], ls[[1]], ls[[2]]}, {assoc[["a"]], assoc["a"],
       assoc[[Key@b]], assoc@Key@b,
       Query["a"][assoc]}, {Query[1, Key["a"]][dataset],
       dataset[1, Key["a"]]}},
     {{ls[[3]], ls[[-1]]}, {assoc[[3]], assoc[[-1]], assoc[a],
       assoc["b"]}, {dataset[1, 3], dataset[1, -1],
       dataset[1, Key["d"]]}},
     {{ls[[1 ;; 3]], ls[[1 ;; 3 ;; 2]], Take[ls, {1, 3}],
       Query[Take[{1, 3}]][ls]}, {assoc[[1 ;; 3]],
       assoc[[1 ;; 3 ;; 2]], Take[assoc, {1, 3}],
       Take[assoc, {1, 3, 2}],
       Query[1 ;; 3][assoc]}, {dataset[1, 1 ;; 3],
       Query[1, 1 ;; 3][dataset]}},
     {{Query[{1, 3}][ls], ls[[{1, 3}]]}, {Query[{1, 3}][assoc],
       assoc[[{1, 3}]], assoc[[{"a", "c"}]],
       KeyTake[assoc, {"a", "c"}]}, {dataset[1, {1, 3}],
       dataset[1, {"a", "c"}]}},
     {{Cases[ls, _?OddQ], Cases[_?OddQ][ls]}, {Cases[assoc, _?OddQ],
       Cases[_?OddQ][assoc]}, {dataset[1, Cases[_?OddQ]]}},
     {{Query[Select[OddQ]][assoc], Select[ls, OddQ],
       SelectFirst[ls, OddQ]}, {Select[assoc, OddQ],
       Select[OddQ][assoc],
       SelectFirst[assoc, OddQ]}, {dataset[1, Select[OddQ]],
       dataset[1, SelectFirst[OddQ]]}},
     {{Position[ls, _?OddQ],
       FirstPosition[ls, _?OddQ]}, {Position[assoc, _?OddQ],
       Position[_?OddQ][assoc],
       FirstPosition[assoc, _?OddQ]}, {dataset[1, Position[_?OddQ]],
       dataset[1, FirstPosition[_?OddQ]]}},
     {{PositionIndex[ls],
       Query[PositionIndex][ls]}, {PositionIndex[assoc],
       Query[PositionIndex][assoc]}, {dataset[1, PositionIndex]}},
     {{Select[Keys@assoc, MemberQ[{"a", "c"}, #] &]}, {KeySelect[
        assoc, MemberQ[{"a", "c"}, #] &],
       KeySelect[assoc, <| "a" -> True, "c" -> True |>]}, {dataset[1,
        KeySelect[(# == "a" \[Or] # == "c") &]]}},
     {{f[ls[[3]]], Query[3, f][ls]}, {f[assoc[["c"]]],
       Query["c", f][assoc]}, {dataset[1, "c", f],
       dataset[1, 3, f]}},
     {{f /@ ls, Map[f][ls], Query[Map[f]][ls]}, {f /@ assoc,
       Map[f][assoc]}, {dataset[1, Map@f], dataset[1, All, f]}},
     {{MapIndexed[f, ls], MapIndexed[f][ls]}, {MapIndexed[f, assoc],
       MapIndexed[f][assoc]}, {dataset[1, MapIndexed[f]]}},
     {{MapAt[f, ls, 2], MapAt[f, 2][ls]}, {MapAt[f, assoc, 2],
       MapAt[f, 2][assoc],
       MapAt[f, Key[b]][assoc]}, {dataset[1, MapAt[f, Key@b]]}},
     {{MapAt[f, Normal@assoc, {All, 1}]}, {KeyMap[f, assoc],
       KeyMap[f][assoc]}, {dataset[1, KeyMap[f]]}},
     {{Reverse /@ Normal@assoc,
       Association[f /@ Normal@assoc]}, {AssociationMap[Reverse,
        assoc], AssociationMap[f, assoc]}, {dataset[1,
        AssociationMap@Reverse], dataset[1, AssociationMap[f]]}},
     {{Sort@ls, Sort[ls, Greater],
       Query[Sort[#1, Greater] &][ls]}, {Sort@assoc,
       Sort[assoc, Greater],
       Query[Sort[#1, Greater] &][assoc]}, {dataset[1, Sort],
       dataset[1, Sort[#, Greater] &]}},
     {{Total[ls]}, {Total[assoc], Query[Total][assoc],
       Query[Values /* Total][assoc]}, {dataset[1, Total],
       dataset[1, All /* Total], dataset[1, Total@*Values]}},
     {{Through[{Min, Max, Total, Variance, Median}@
         ls]}, {Query[{Min, Max, Total, Variance, Median}][
        assoc]}, {dataset[1, {Min, Max, Total, Variance, Median}]}},
     {{Through[{Histogram, BarChart, SmoothHistogram, PieChart,
          ListLinePlot[#, Filling -> Axis] &}@ls]},
      {Query[{Histogram, BarChart, SmoothHistogram, PieChart,
          ListLinePlot[#1, Filling -> Axis] &}][
        assoc]}, {dataset[
         1, {Histogram, BarChart, SmoothHistogram, PieChart,
          ListLinePlot[#1, Filling -> Axis] &}] // Normal}},
     {{Thread[Keys[assoc] -> ls]}, {AssociationThread[
        Keys[assoc] -> ls],
       AssociationThread[Keys[assoc],
        ls]}, {dataset[
         1, {AssociationThread[Keys@#,
            Values@#] &, (Keys@# -> Values@#) & /*
           AssociationThread}] // Normal}},
     {{Thread[Keys[assoc] -> f /@ Keys[assoc]]}, {AssociationMap[f,
        Keys[assoc]],
       Query[AssociationMap[f]@*Keys][assoc]}, {dataset[1,
        Keys /* AssociationMap[f]]}},
     {{(f[#1, #2, #3] &)[Sequence @@ ls]}, {(f[#a, #1[Key[b]], #c] &)[
        assoc], (f[#1["a"], #1[Key[b]], #1["c"]] &)[assoc]}, {dataset[
        1, All /* (f[#a, #1[Key[b]], #c] &)],
       dataset[1, (Apply@f)@*Catenate]}},
     {{(f[##1] &)[Sequence @@ ls], (f[##2] &)[
        Sequence @@ ls]}, {((f[##] &)[Sequence @@ Values@#] &)[
        assoc]}, {dataset[1,
        Values /* (Sequence @@ # &) /* (f[##] &)],
       dataset[1, (f[##] &)@*(Sequence @@ # &)@*Values]}}
     } // InsertIOCells
   }, Frame -> True,
  Dividers -> {Thick, {Thick, {None}, Thick}, {3 -> Thick, 8 -> Thick,
      13 -> Thick, 19 -> Thick, 23 -> Thick, 25 -> Thick}},
  Alignment -> {Center, Center},
  Background -> {Automatic, {ColorData[17, 4],
     LightBrown, {LightBlue, LightGreen}}},
  ItemStyle -> {Automatic, {19}}, Spacings -> {1, {1, 1, 1, {0.5}}}]]


Datasets, and makeDatasetsitself not very interesting to Data Science at the present stage. Another serious limitation is the memory issue, as you can see here. $\endgroup$