Consider the following demand of products for the next four months.
data={1,20,3,40};
I could produce the whole demand in the first months, leading to the following "production vector": {63,0,0,0}.
As you can imagine, producing everything in the first month leads to high costs of inventory. Another possibility would be {21,0,43,0}.
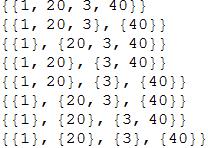
Now I would like to get all possible combinations of the subsets of data, leading to:
results=
{{{1},{20,3,40}},
{{1,20},{3,40}},
{{1,20,3},{40}},
{{1},{20,3},{40}},
{{1},{20},{3},{40}},
{1,20,3,4}
}
It is important that Table[Map[Flatten,results][[i]]==data,{i,Length@results}] is True for all i. This means that each sublist of results has the same order of figures as in data.

