0
$\begingroup$

I have created the following function for plotting

plotDynamical[iterMethod_, points_] := 
 DensityPlot[
  iterAlgorithm[iterMethod], {t, xxMin, xxMax}, {s, yyMin,yyMax}, 
  PlotRange -> {1,4}, ColorFunction -> {Orange, Blue, Black, Green}, 
  PlotPoints -> points]

The possible results of " iterAlgorithm[iterMethod] " are 1 , 2, 3 or 4. I would like to assigning colours to numbers like so: Orange to 1,Blue to 2,Black to 3 and Green to 4. How can I do this?

complete my Algorithm is:

F = Compile[{{t, _Real}, {s, _Real}}, {t^2 + s^2 - 4, -Exp[t] + s - 
     1}];
dF = Compile[{{t, _Real}, {s, _Real}}, {{2 t, 2 s}, {-E^t, 1}}];
invdF = Compile[{{t, _Real}, {s, _Real}}, {{1/(
     2 E^t s + 2 t), -((2 s)/(2 E^t s + 2 t))}, {E^t/(
     2 E^t s + 2 t), (2 t)/(2 E^t s + 2 t)}}];

rootF[1] = {-1.59832066552612835, 1.202235854627582} ;
rootF[2] = {0, 2} ;


rootPosition = 
 Compile[{{t, _Real}, {s, _Real}}, 
  Which[Norm[{t, s} - rootF[1]] < 10.0^(-10), 3,
   Norm[{t, s} - rootF[2]] < 10.0^(-10), 2, True, 
   1], {{rootF[_, _], _Real, _Real}}];

iterPsM10 = Compile[{{t, _Real}, {s, _Real}},
  Block[{v = F[t, s], w = dF[t, s], u = invdF[t, s], x, y, z, dFz, Q, 
    uu, vv, Fu, vu, invdFvu},
   x = {t, s};
   y = x - (1/2 ) u.v;
   z = 1/3 (4 y - x);
   dFz = dF @@ ({z[[1]], z[[2]]});
   Q = Inverse[w - 3 dFz];
   uu = y + Q.v;
   Fu = F @@ ({uu[[1]], uu[[2]]});
   vv = uu + 2 Q.Fu;
   vu = 1/2 (vv + uu);
   invdFvu = invdF @@ ({vu[[1]], vu[[2]]});
   uu - invdFvu.Fu]];

iterAlgorithm[iterMethod_, lim_] := 
 Block[{ct, r}, ct = 0; r = rootPosition[t, s];
  While[(r == 1) && (ct < lim), ++ct; {t, s} = iterMethod[t, s]; 
   r = rootPosition[t, s]];
  If[Head[r] == Which, r = 0];(*"Which" unevaluated*)Return[r]];

limIterations = 1000;
xxMin = -5; xxMax = 5; yyMin = -5; yyMax = 5;

plotDynamical[iterMethod_, points_] := 
 DensityPlot[iterAlgorithm[iterMethod, limIterations],
  {t, xxMin, xxMax}, {s, yyMin, yyMax}, PlotRange -> {0, 3}, 
  ColorFunction -> {Green, Black, Orange, Blue},
  PlotPoints -> points, 
  Epilog -> {White, PointSize[.02], Point[rootF[1]], Point[rootF[2]]}];


plotDynamical[iterPsM10, 56]
$\endgroup$
2
  • $\begingroup$ Hi @user14345, welcome to Mathematica.SE. I have edited your question best as I could but it's still unclear as it's depending on the output of the function iterAlgorithm. Could you perhaps post a minimal example of how it works? Also, it will be helpful to read the help section (you get a badge for doing so!) and in particular the markdown guide on how to better format your questions. Don't forget to upvote other people's questions and answers if you think they are worth it! $\endgroup$
    – gpap
    Commented May 15, 2014 at 8:59
  • 1
    $\begingroup$ Also it's a good idea to post stand-alone code (code that someone will copy-paste and it will run as is). The way your question is formed, one needs not only the funciton iterAlgorithm but also xxMin, xxMax, yyMin, yyMax. Finally, perhaps you may want to switch your username to something a little more memorable? $\endgroup$
    – gpap
    Commented May 15, 2014 at 9:00

2 Answers 2

2
$\begingroup$

As you don't provide a working example I have used a simple function to plot a DensityPlot. You can use for example a Piecewise function as the ColorFunction to determine the colour of your data points:

DensityPlot[Sin[x y], {x, 0, 3}, {y, 0, 3}, 
 ColorFunction -> 
  Function[{x, y}, 
   Piecewise[{{Orange, 0 <= x < 0.25}, {Blue, 0.25 >= x < 0.5}, {Red, 
      0.5 <= x < 0.75}, {Green, 0.75 <= x <= 1}}, Yellow]], 
 PlotPoints -> 50]

In your case you would have to set the ranges to Piecewise[{{Orange, x==1},{Blue, x==2},{ and so on

$\endgroup$
5
  • $\begingroup$ how to use this method in above algorithm? $\endgroup$
    – user14345
    Commented May 15, 2014 at 10:28
  • $\begingroup$ This idea can't work with this algorithm . $\endgroup$
    – user14345
    Commented May 15, 2014 at 12:41
  • $\begingroup$ The above method dosn't work correctly!the output colors is't correct. $\endgroup$
    – user14345
    Commented May 15, 2014 at 22:52
  • $\begingroup$ spot following example: $\endgroup$
    – user14345
    Commented May 15, 2014 at 22:54
  • $\begingroup$ f[x_, y_] := Which[x/y == 2, 2, x/y == 3, 3, x/y == 1, 0, True, 1]; DensityPlot[f[x, y], {x, 0, 3}, {y, 0, 3}, ColorFunction -> Function[{x, y}, Piecewise[{{Blue, x == 3}, {Orange, x == 2}, {Black, x == 1}, {Green, x == 0}}, Yellow]], PlotPoints -> 32] $\endgroup$
    – user14345
    Commented May 15, 2014 at 22:54
1
$\begingroup$

(Minor brain failure, but after applying the jumper cables...)

Here is a function that returns a value in the set (1, 2, 3, 4):

fn = Floor @ Mod[# + Sin[#2], 4, 1] &

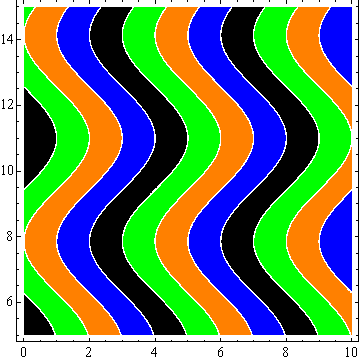
In a DensityPlot:

DensityPlot[fn[t, s], {t, 0, 10}, {s, 5, 15}, PlotPoints -> 50, 
 ColorFunction -> {Orange, Blue, Black, Green}]

enter image description here

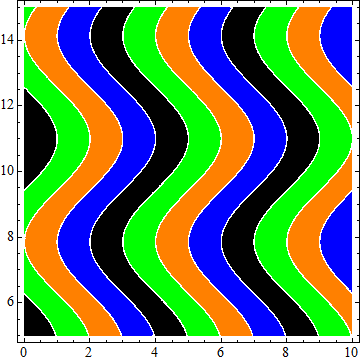
Or as a ContourPlot:

ContourPlot[fn[t, s], {t, 0, 10}, {s, 5, 15},
 Contours -> {1, 2, 3, 4},
 ContourShading -> {Green, Orange, Blue, Black},  (* thanks kguler *)
 PlotPoints -> 50
]

enter image description here

$\endgroup$
4
  • 1
    $\begingroup$ ContourShading -> {Orange, Blue, Black, Green} instead of ColorFunction->... also works (+1) $\endgroup$
    – kglr
    Commented May 15, 2014 at 23:09
  • $\begingroup$ @kguler ah, yes... $\endgroup$
    – Mr.Wizard
    Commented May 15, 2014 at 23:09
  • $\begingroup$ @kguler I think the order has to be changed though; see above. Do you agree? $\endgroup$
    – Mr.Wizard
    Commented May 15, 2014 at 23:20
  • $\begingroup$ yes... need to rotate right the color list - not sure why though. $\endgroup$
    – kglr
    Commented May 15, 2014 at 23:41

Your Answer

By clicking “Post Your Answer”, you agree to our terms of service and acknowledge you have read our privacy policy.

Not the answer you're looking for? Browse other questions tagged or ask your own question.