4
$\begingroup$

I've seen the Wolfram Poincaré example.

I'd like to modify this sample in order to have a list of Poincaré maps. In the example the event is captured only when Mod[t, 2 Pi] == 0. I want to create a map of angles (0, Pi/2, Pi, 3 Pi/2, 2Pi for example) and create the Poincaré for every angle, in order to create an animation showing the map for every angle.

Obviously I can create data for every angle, putting the the example inside a Table command and varying the angle, but it seems a waste of time, because I must perform NDSolve every time.

Instead it can be helpful to find a way to use NDSolve only once and save directly the list of data for all angles that I want.

I've tried to change Mod[t, 2 Pi] == 0 to Mod[t, 2 Pi] == 0 || Mod[t, Pi] == 0, because I wanted to create a unique list, check it's length and then rearraing data in some way in order to obtain the map list, but I obtain the following error

Part::partw: "Part 1 of {} does not exist.

And data is

{{{}}, {}}[[-1, 1]]

Why I obtain this error and how can I have different sections using NDSolve only once?

$\endgroup$
1
  • $\begingroup$ I updated the answer to show many-events animation. $\endgroup$ Commented Apr 21, 2014 at 13:02

1 Answer 1

16
$\begingroup$

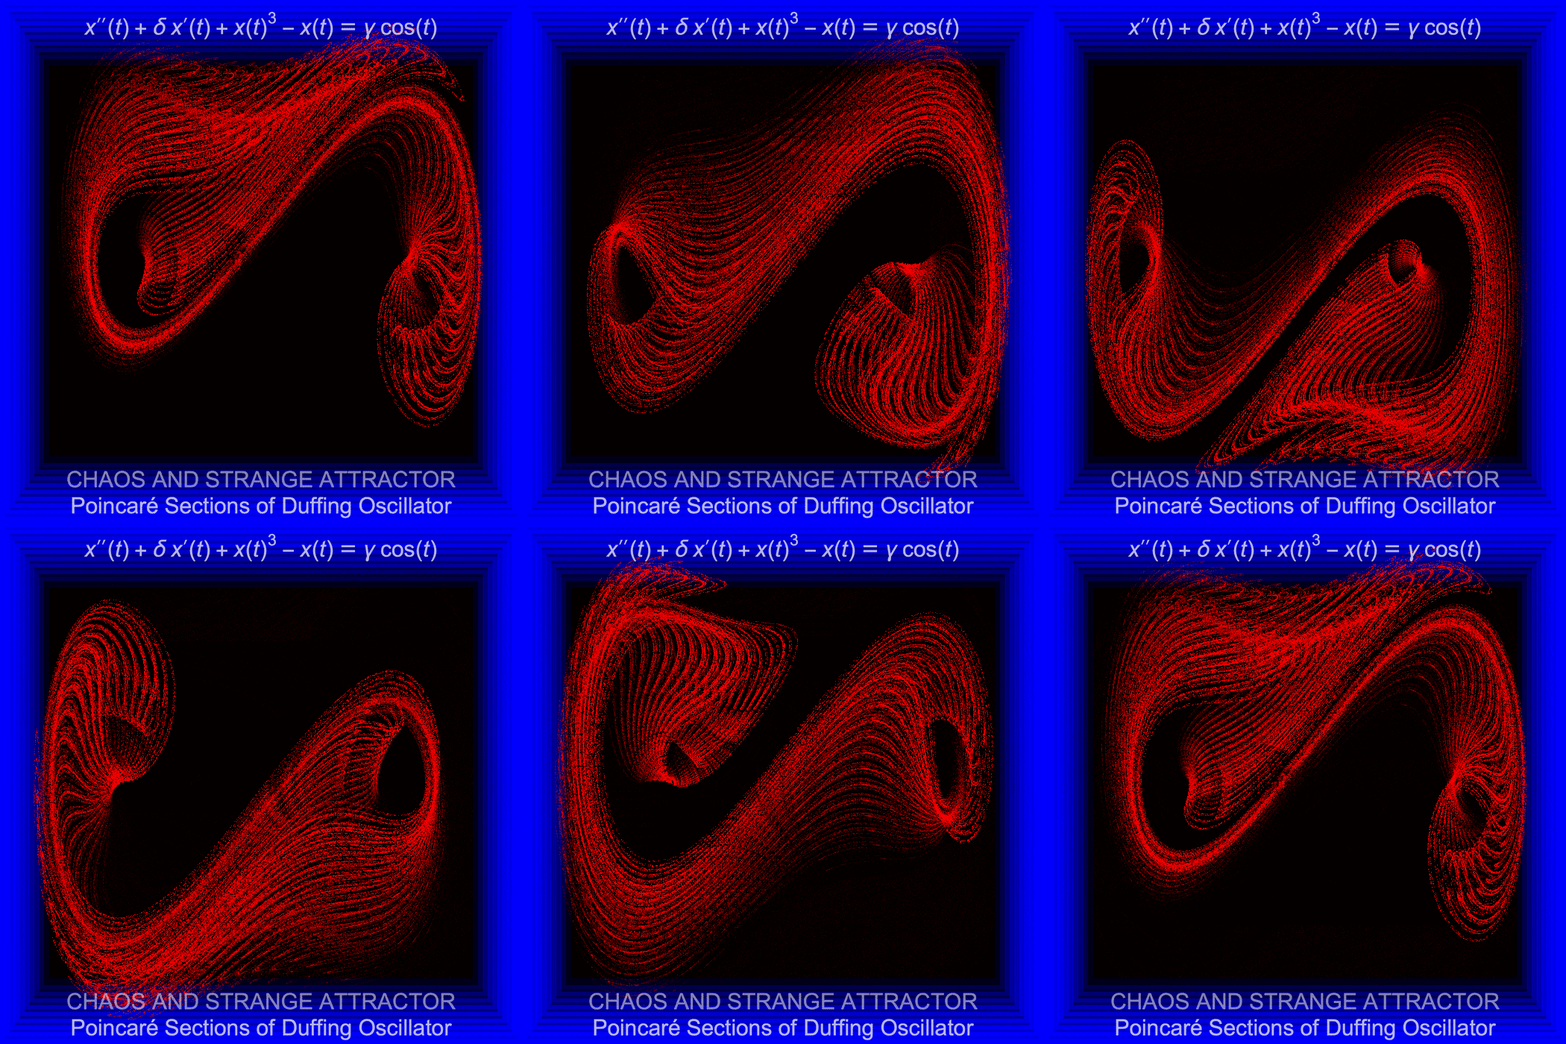
Update: art

I made a special art animation base don this. Full code is HERE.

art

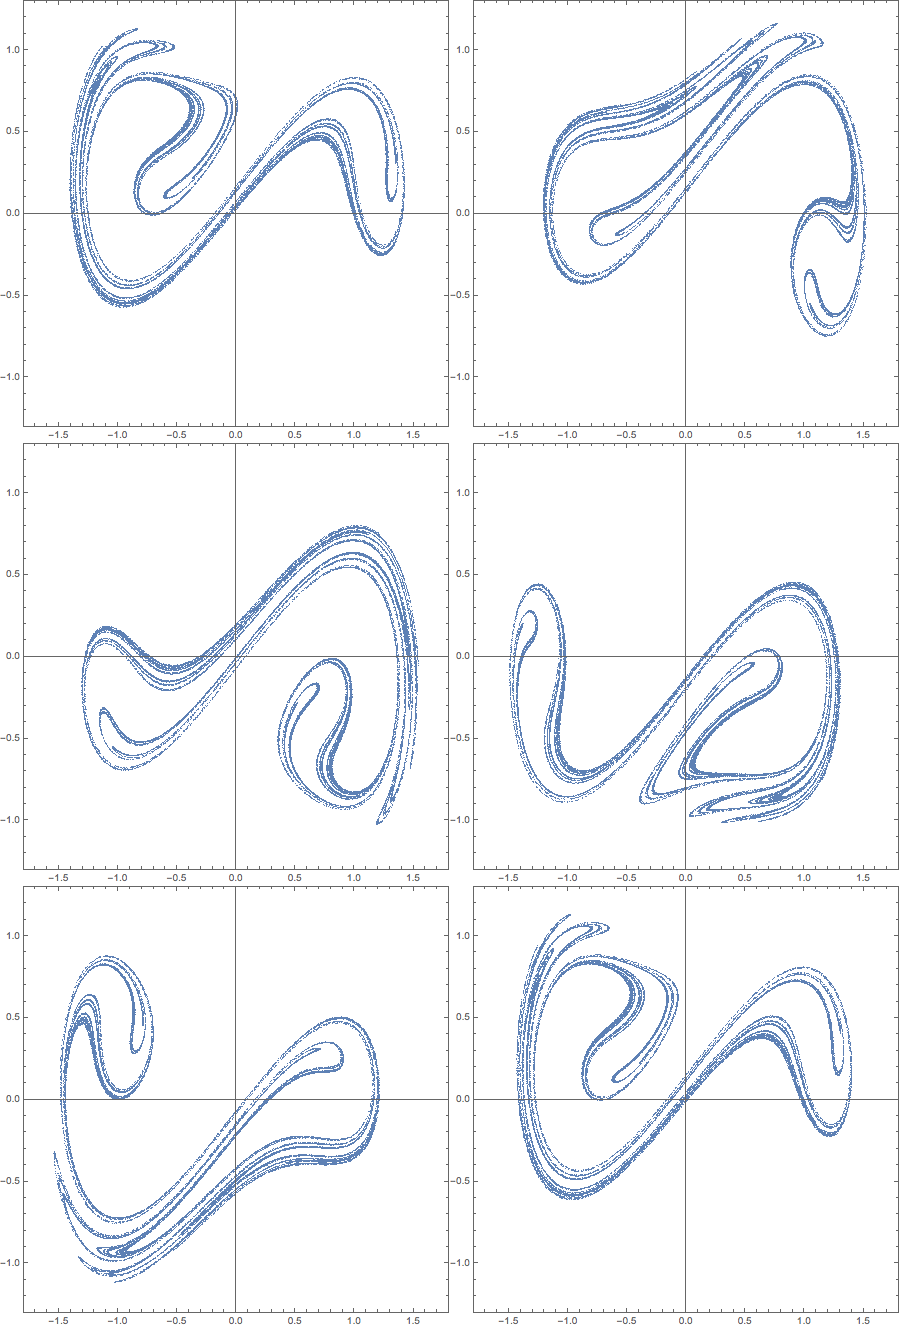
Update: art animation

This animation has about 50 frames - meaning it's obtained from tracking 50 independent events during single run of numerical solver:

enter image description here

Code is simply given by:

evs = Mod[t, 2 \[Pi]] == # & /@ (Range[0, 2 Pi - #, #] &@(2 Pi/50));

data = Block[{δ = 0.15, γ = 0.3}, Reap[NDSolve[{x''[t] + δ x'[t] - x[t] + 
        x[t]^3 == γ Cos[ t], x[0] == 0, x'[0] == 0, 
      WhenEvent[Evaluate@evs, 
       Sow[{x[t], x'[t]}, Round[100 Mod[t, 2 π]]]]}, {}, {t, 0, 
      200000}, MaxSteps -> ∞]]];

Export["test.gif",
 Table[ListPlot[data[[2]][[k]], PlotStyle -> PointSize[0], 
   PlotRange -> {1.8 {-1, 1}, 1.3 {-1, 1}}, AspectRatio -> 1, 
   Frame -> True, ImageSize -> 450], {k, 1, 50, 1}]
 ]

Older: testing grounds

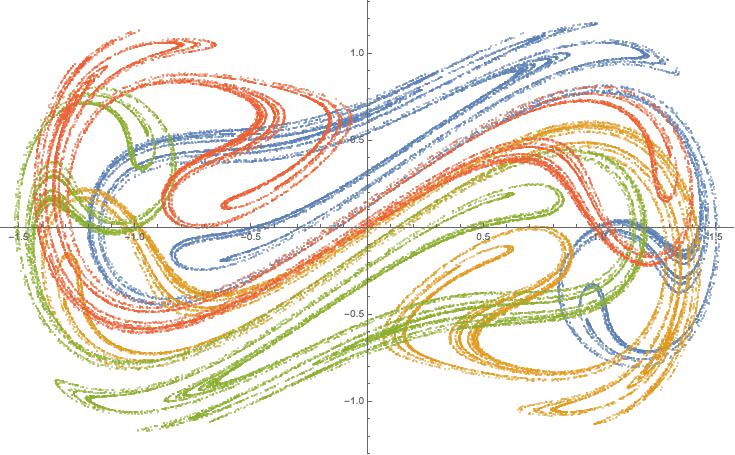
Put independent events in List when you need a few of them. Then to separate while Sow/Reap - use tags in Sow - for example for 4 different events. I'll show all of them on a single plot to compare. Just use Manipulate or Animate or ListAnimate for your goal.

data = Block[{δ = 0.15, γ = 0.3}, 
   Reap[NDSolve[{x''[t] + δ x'[t] - x[t] + 
        x[t]^3 == γ Cos[ t], x[0] == 0, x'[0] == 0, 
      WhenEvent[{Mod[t, 2 π] == 0, Mod[t, 2 π] == π/2, 
        Mod[t, 2 π] == π, Mod[t, 2 π] == (3 π)/2}, 
       Sow[{x[t], x'[t]}, Round@Mod[t, 2 π]]]}, {}, {t, 0, 
      100000}, MaxSteps -> ∞]]];


ListPlot[data[[2]], ImageSize -> Medium, 
 PlotRange -> {{-1.5, 1.5}, All}, PlotStyle -> PointSize[0.0025]]

enter image description here

$\endgroup$
4
  • $\begingroup$ thanks a lot. it solved my problem. $\endgroup$
    – Jepessen
    Commented Apr 19, 2014 at 10:05
  • 2
    $\begingroup$ Nice plot! Looks like pastel. $\endgroup$
    – chris
    Commented Apr 19, 2014 at 14:32
  • $\begingroup$ @chris it's the new default color palette in Mathematica 10, available for free for the Raspberry Pi. See the documentation of PlotTheme. $\endgroup$
    – shrx
    Commented Apr 19, 2014 at 23:34
  • $\begingroup$ @VitaliyKaurov Dear Vitaliy, you seem to be very versed in these functionalities of Mathematica, whenever you have some time, could you help out a bit here: mathematica.stackexchange.com/questions/63484/… Thanks a lot in advance. $\endgroup$
    – Ellie
    Commented Oct 18, 2014 at 14:02

Your Answer

By clicking “Post Your Answer”, you agree to our terms of service and acknowledge you have read our privacy policy.

Not the answer you're looking for? Browse other questions tagged or ask your own question.