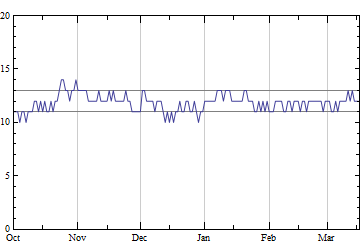
I want to count the number of times events take place in a date range. The counting is done over a window of e.g. 28 days where the goal is to have between 11 and 13 events in the time window. The date range for the counting is e.g. from last October until now.
My current solution seems to be inefficient, both timing wise (it takes almost 63 seconds for this small, sample test data) and from an intuitive way of thinking about the problem (with no repeated recounting of values).
My question is: How can I solve this problem in a more efficient and elegant way?
Here is my version
sumEventsInRange[targetDate_, eventlist_, minDiff_, maxDiff_] :=
  Length[Select[
    eventlist, (minDiff < DateDifference[Part[#, 2], targetDate] <
       maxDiff) & ] ];

dvHITS = Drop[
   Last[Import[
     "https://docs.google.com/spreadsheet/ccc?key=\
0AstJzCCxOXH1dDdBaDRHMW5FMFFFVzhPRnpTUXlrU1E&usp=sharing", "Data"]],
   1];

DateListPlot[
 Transpose[{DateRange[{2013, 10, 1},
    now], (sumEventsInRange[#, dvHITS, 0, 28] &) /@
    DateRange[{2013, 10, 1}, now]}],
 PlotRange -> {{{2013, 10, 1}, now}, {0, 20}},
 GridLines -> {Automatic, {11, 13}}, Joined -> True]
Which generates the following plot


SparseArrayproperties andAbsoluteTime, you can get results for all dates with an arbitrary window size in a few hundredths of a second. $\endgroup$