2
$\begingroup$

I have

h[phi_, delta_] := ArcCos[-Tan[phi Degree] Tan[delta Degree]]
insolation[phi_, delta_, S_: 1368] := (S/Pi) (Cos[delta Degree] Cos[phi Degree] Sin[h] + h Sin[delta Degree] Sin[phi Degree]) /. h -> h[phi, delta]
ContourPlot[insolation[phi, 23.5 Cos[t]], {t, -Pi, Pi}, {phi, -90, 90},
    PlotLegends -> Automatic, ContourLabels -> False, Contours -> 20, 
    ColorFunction -> "TemperatureMap"]

But the resulting figure has areas that are "missing":
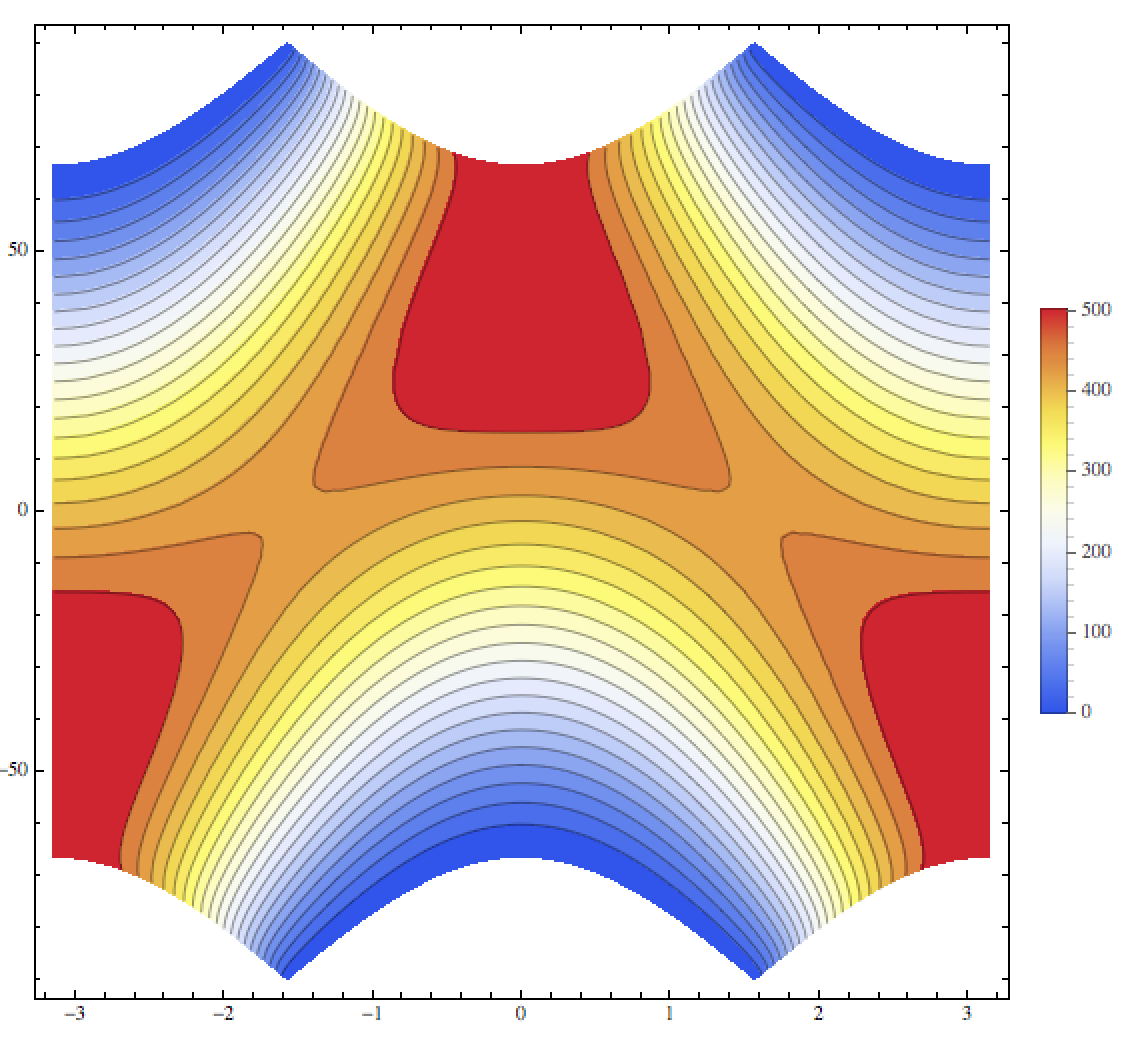
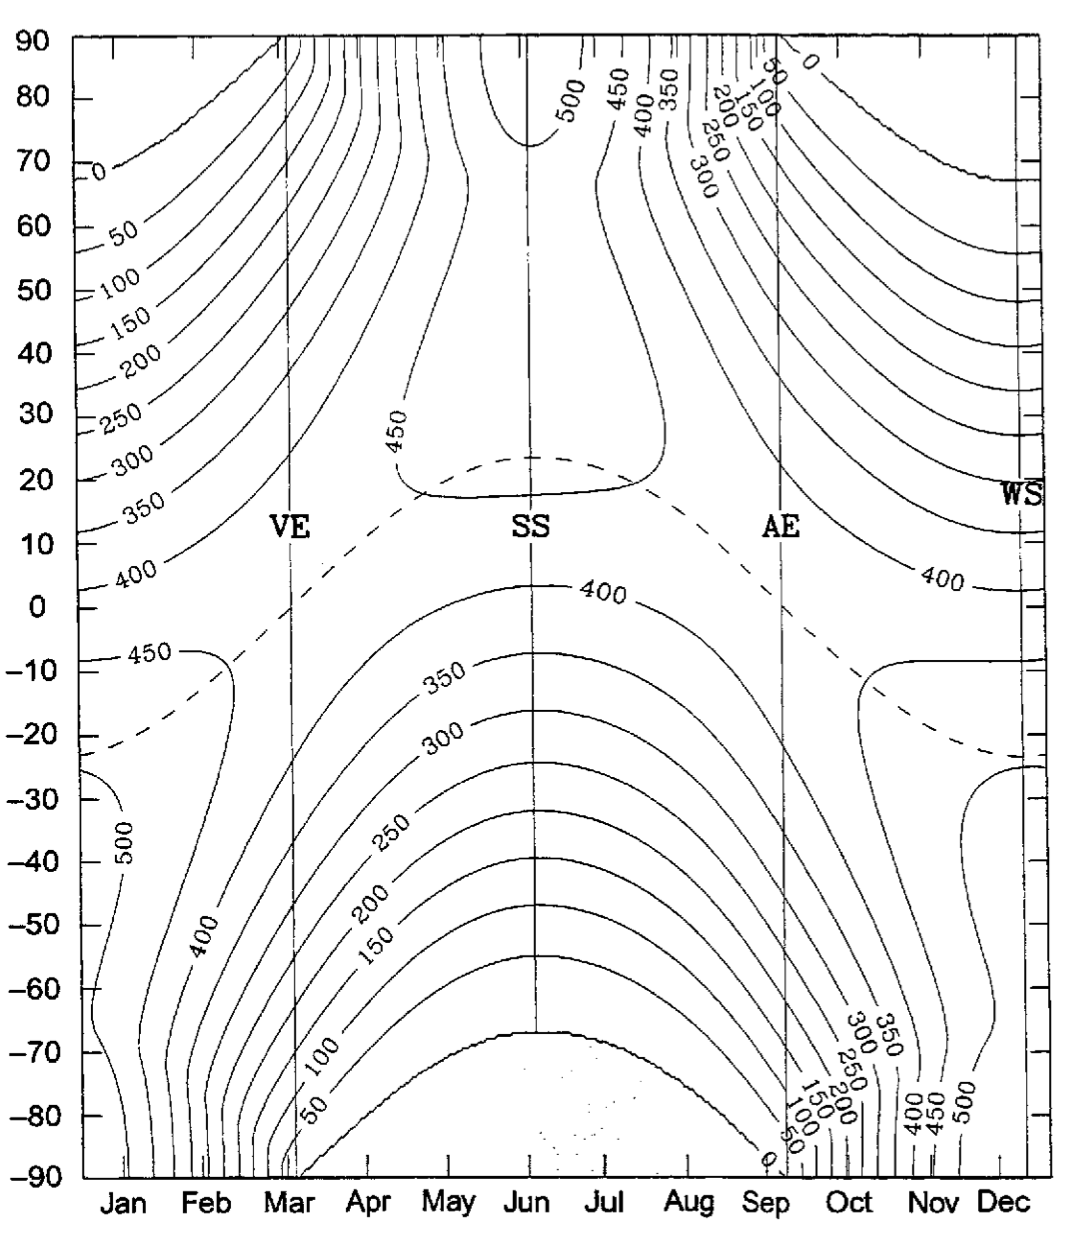
What am I doing wrong? How do I get the expected vertical contours extending from the truncated edges to the near horizontal axis in the upper center and bottom right and left corners? How to I "fill in" the regions in the upper right and left corners that are 0?


A similar figure for comparison:
$\endgroup$
9
  • $\begingroup$ @Kuba: How do I prevent my uploaded images from being HUGE when I upload Retina screenshots (maybe a meta question; this issue must have come up before)? $\endgroup$
    – orome
    Commented Mar 12, 2014 at 19:19
  • $\begingroup$ Make it a meta question and I'll reply. $\endgroup$
    – Szabolcs
    Commented Mar 12, 2014 at 19:19
  • 1
    $\begingroup$ That region of the contour plot is white because the expression insolation[phi, 23.5 Cos[t]] evaluates to non-real complex numbers at those t,phi points. I tried this by right-clicking the plot, and using Get Coordinates to sample coordinates from that region, then putting them into the expression. $\endgroup$
    – Szabolcs
    Commented Mar 12, 2014 at 19:20
  • $\begingroup$ @Szabolcs: Asked. $\endgroup$
    – orome
    Commented Mar 12, 2014 at 19:23
  • 1
    $\begingroup$ @Kuba I must leave now and I might forget when I come back ... feel free to post it yourself and include the PlotRange->All comment .. $\endgroup$
    – Szabolcs
    Commented Mar 12, 2014 at 20:22

1 Answer 1

4
$\begingroup$

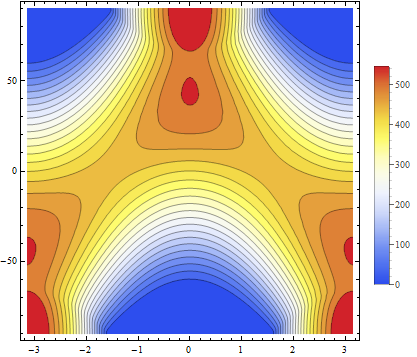
Usually such issue is caused by Automatic Range and PlotRange->All would be a fix. It's not the case though.

Szabolcs has noticed:

That region of the contour plot is white because the expression insolation[phi, 23.5 Cos[t]] evaluates to non-real complex numbers at those t, phi points. I tried this by right-clicking the plot, and using GetCoordinates to sample coordinates from that region, then putting them into the expression.

So the quick fix is to take only a real part:

ContourPlot[
 Re@insolation[phi, 23.5 Cos[t]], {t, -Pi, Pi}, {phi, -90, 90}, 
 PlotLegends -> Automatic, ContourLabels -> False, Contours -> 20, 
 ColorFunction -> "TemperatureMap"]

enter image description here

Keep in mind that PlotRange issue could be still a case here, but it isn't :).

Also, this is quick fix, but at the end one should think what taking a real part means for us here or what does it mean our function produced complex values.

$\endgroup$

Your Answer

By clicking “Post Your Answer”, you agree to our terms of service and acknowledge you have read our privacy policy.

Not the answer you're looking for? Browse other questions tagged or ask your own question.