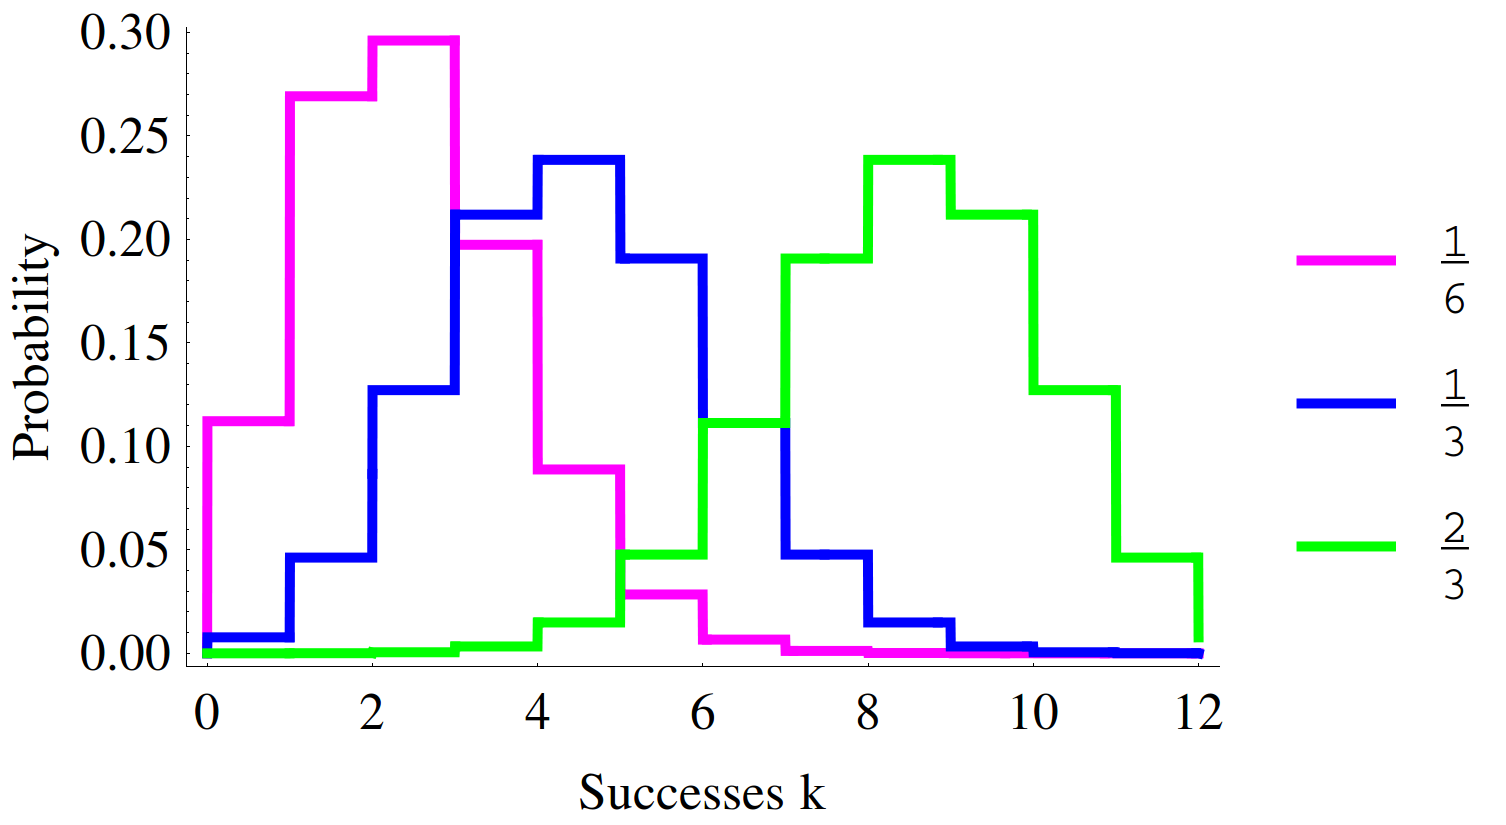
I often find myself trying to plot multiple PDFs for my courses. I find the default tools available to me are lacking and/or cumbersome. After readings some suggestions here, I have come up with the following code to plot 3 instances of the Binomial Distribution. I'm hoping this will prove useful to others (perhaps even myself). I'm also wondering if folks can improve on this.
n = 12;
plist = {1/6, 1/3, 2/3};
colorList = {Magenta, Blue, Green};
Plot[Evaluate[
  Map[PDF[BinomialDistribution[n, #], Floor[k]] &,
   plist]], {k, -0.001, n + 0.001},
 Exclusions -> None,
 PlotStyle -> Map[{Thick, #} &, colorList],
 PlotLegends -> plist,
 Frame -> {True, True, False, False},
 FrameTicks -> {Table[i, {i, 0 , n, 2}], Automatic},
 FrameLabel -> {"Successes k", "Probability"}]
Here's the output


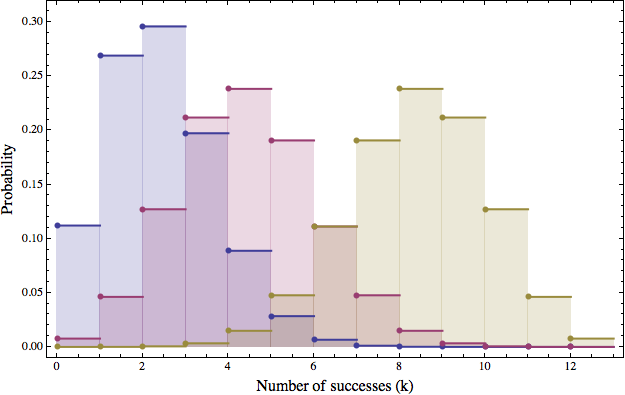
DiscretePlot? $\endgroup$