General purpose
My intension is to use data created by Mathematica as in
- Export Plots to $\LaTeX$,
- $\LaTeX$ and Mathematica, or
- How to export multiple Barcharts from Mathematica to $\LaTeX$
but with a nicer $\LaTeX$ conform font style and similar stuff. This is the reason why I am using the $\LaTeX$ package pgfplots. This package also allows me to add further information and fancy graphical stuff (by using TikZ) to the plot at later time.
Issue
Now I do not get Mathematica to write me a data-file which can be read by the $\LaTeX$ package pgfplots. The current data (and export) has the following structure:
DataTable = {{9/50, 5.00251*10^9, 3.02252*10^9, 2.17472*10^9, 1.97472*10^9},<<1000>>};
Export["Energy.csv", DataTable];
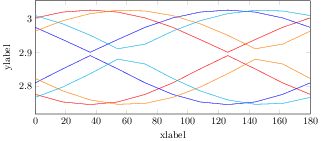
The idea is to plot in the end something like
\documentclass{standalone}
\usepackage{pgfplots}
\pgfplotsset{compat=newest}

\begin{document}
\begin{tikzpicture}
\begin{axis}[%
    xlabel={xlabel},
    ylabel={ylabel}]
\addplot[color=blue,mark=none]
    table [x expr=\thisrowno{0}, y expr=\thisrowno{1}, col sep=space] {data.dat};
\addplot[color=blue,mark=none]
    table [x expr=\thisrowno{0}, y expr=\thisrowno{2}, col sep=space] {data.dat};
\end{axis}
\end{tikzpicture}
\end{document}
EDIT:
The $\LaTeX$ routine pgfplots uses the following data structure (where the option col sep=space|tab|comma|colon|semicolon|braces|&|ampersand defines the separation character - same is also vaid for the column separation row sep=newline|\\):
Field,Energy1,    Energy2,    Energy3,    Energy4
9/50, 5.00251e+09,3.02252e+09,2.17472e+09,1.97472e+09
... (all data like this first row of data)
You might want to check out chapter 4.3.2 (Reading Coordinates From Tables) in the pgfplots manual which contains all important informations. By the way the header is not necessary but helps other readers to understand your data.


9/50,5.00251e9,3.02252e9,2.17472e9,1.97472e9. In you pgfplots code, you useddata.datwhich should bedata.csvwith your current approach. What exactly is the issue? $\endgroup$data.datfile. You are completely right. +1 I will rephrase an answer out of my question for other interested people (as I invested too much time in that issue). $\endgroup$