5
$\begingroup$

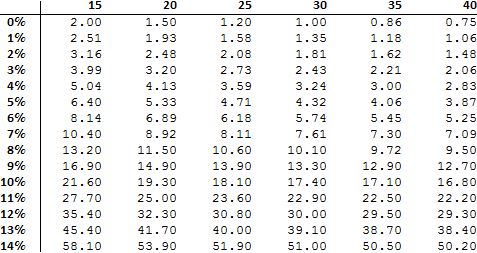
Basically I want to build a chart like something I would do in Excel. It should look like this:

enter image description here

Here is the formula I'm using and what I've done so far

a[r_, n_, d_] := (((1 + r)^n) - 1)/(1 - (1 + r)^-d)

TableForm[
   Table[AccountingForm[a[r, 30, d], 3],
         {r, .000000000001, .15, .01}, {d, 15, 40, 5}],
   TableHeadings -> {
          {"0%","1%","2%","3%","4%","5%","6%","7%","8%","9%","10%","11%","12%","13%","14%"},
          {"15", "20", "25", "30", "35", "40"}
     }]

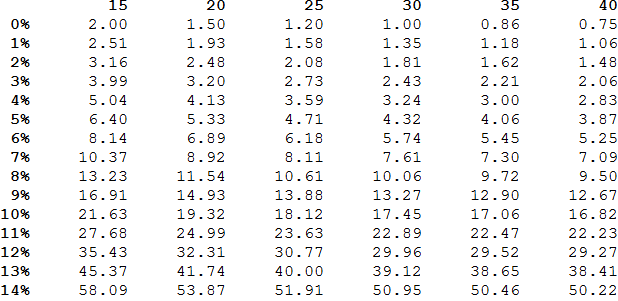
This is the output I'm getting:

enter image description here

Basically all I want is the integer plus 2 decimal places. What am I missing?

Is there a way to automatically generate the headings based on the changing value of r and d?

$\endgroup$
1
  • $\begingroup$ Related: (8923). $\endgroup$
    – Silvia
    Commented Dec 22, 2013 at 4:23

4 Answers 4

4
$\begingroup$

While ubpdqn has ansered the first of your questions already here a solution to your second question:

    robksTable[rstart_, rend_, dstart_, dend_] := 
 TableForm[
  Table[PaddedForm[a[r, 30, d], {3, 2}], {r, rstart, rend, .01}, {d, dstart, dend, 5}], 
  TableHeadings -> {(ToString[#] <> "%") & /@ IntegerPart[100 Range[rstart, rend, 0.01]], 
    ToString /@ Range[dstart, dend, 5]}, TableAlignments -> Right]

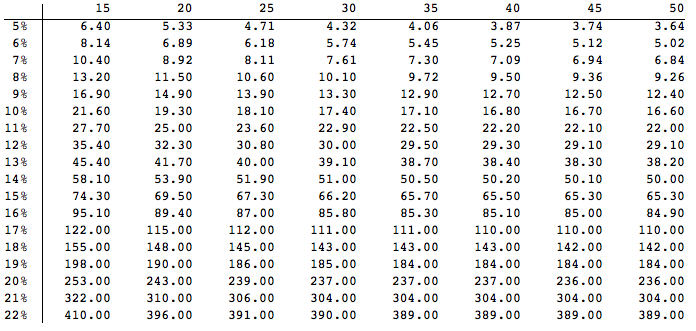
robksTable[0.05, .22, 15, 50]

enter image description here

$\endgroup$
5
$\begingroup$

You can use Accounting to do this. It has the options available.

a[r_, n_, d_] := (((1 + r)^n) - 1)/(1 - (1 + r)^-d)
padIt[v_?(Element[#, Reals] &), f_List] := 
  AccountingForm[v, f, NumberSigns -> {"-", "+"}, 
   NumberPadding -> {"0", "0"}, SignPadding -> True];

TableForm[
 Table[padIt[a[r, 30, d], {3, 2}], {r, .000000000001, .15, .01}, {d,15, 40, 5}], 
 TableHeadings -> {{"0%", "1%", "2%", "3%", "4%", "5%", "6%", "7%", 
    "8%", "9%", "10%", "11%", "12%", "13%", "14%"}, {"15", "20", "25",
     "30", "35", "40"}}]

Mathematica graphics

If you do want exact size of columns, with the sign there, use {4, 2} instead of {3,2} in the call above

Mathematica graphics

If you do not want the sign at all, use NumberSigns -> {"", ""} instead and to get the same output as excel, use

padIt[v_?(Element[#, Reals] &), f_List] := 
  AccountingForm[v, f, NumberSigns -> {"", ""}, 
   NumberPadding -> {" ", "0"}, SignPadding -> False];
TableForm[
 Table[padIt[a[r, 30, d], {4, 2}], {r, .000000000001, .15, .01}, {d,15, 40, 5}], 
 TableHeadings -> {{"0%", "1%", "2%", "3%", "4%", "5%", "6%", "7%", 
    "8%", "9%", "10%", "11%", "12%", "13%", "14%"}, {"15", "20", "25",
     "30", "35", "40"}}]

Mathematica graphics

And If you want to left-justify the columns, use

padIt[v_?(Element[#, Reals] &), f_List] := 
  AccountingForm[v, f, NumberSigns -> {"", ""}, 
   NumberPadding -> {" ", "0"}, SignPadding -> False];

TableForm[
 Table[padIt[a[r, 30, d], {3, 2}], {r, .000000000001, .15, .01}, {d,15, 40, 5}], 
 TableHeadings -> {{"0%", "1%", "2%", "3%", "4%", "5%", "6%", "7%", 
    "8%", "9%", "10%", "11%", "12%", "13%", "14%"}, {"15", "20", "25",
     "30", "35", "40"}}]

Mathematica graphics

and finally, if you do not want space in the columns, you can use

padIt[v_?(Element[#, Reals] &), f_List] := 
  AccountingForm[v, f, NumberSigns -> {"", ""}, 
   NumberPadding -> {"0", "0"}, SignPadding -> False];
TableForm[
 Table[padIt[a[r, 30, d], {4, 2}], {r, .000000000001, .15, .01}, {d, 15, 40, 5}], 
 TableHeadings -> {{"0%", "1%", "2%", "3%", "4%", "5%", "6%", "7%", 
    "8%", "9%", "10%", "11%", "12%", "13%", "14%"}, {"15", "20", "25",
     "30", "35", "40"}}]

Mathematica graphics

$\endgroup$
1
  • $\begingroup$ Comprehensive and clear, and informative...a much better answer than mine ->+1 from me $\endgroup$
    – ubpdqn
    Commented Dec 22, 2013 at 6:34
3
$\begingroup$
a[r_, n_, d_] := (((1 + r)^n) - 1)/(1 - (1 + r)^-d)

format[n_?NumberQ] := NumberForm[n, {10, 2}]

rlist = Range[1`*^-12, .15, .01];
dlist = Range[15, 40, 5];

table = Outer[format @ a[#, 30, #2] &, rlist, dlist];

rlbl = {Row[{Round[100 #], "%"}] ~Style~ Bold} & /@ rlist;

clbl = Style[#, Bold] & /@ dlist;

Grid[
 ArrayFlatten[{{"", {clbl}}, {rlbl, table}}],
 Alignment -> Right,
 Spacings -> 3
]

enter image description here

Compared to your request:

$\endgroup$
3
$\begingroup$

You can modify options :

a[r_, n_, d_] := (((1 + r)^n) - 1)/(1 - (1 + r)^-d)

TableForm[
  Table[PaddedForm[
    a[r, 30, d], {3, 2}], {r, .000000000001, .15, .01}, {d, 15, 40, 
    5}], TableHeadings -> {Style[#, Bold, 
       FontFamily -> "Calibri"] & /@ {"0%", "1%", "2%", "3%", "4%", 
      "5%", "6%", "7%", "8%", "9%", "10%", "11%", "12%", "13%", 
      "14%"}, Style[#, Bold, FontFamily -> "Calibri"] & /@ {"15", 
      "20", "25", "30", "35", "40"}}, TableAlignments -> Right]    

enter image description here

UPDATE

As pointed out by Matiriki, I failed to see (and therefore address the second part):

tabf[n_, r0_, r1_, d0_, d1_] := Module[{rs = {}, ds = {}, dat},
  dat = Table[AppendTo[rs, r]; AppendTo[ds, d]; 
    PaddedForm[
     a[r, n, d], {3, 2}], {r, r0, r1, .01}, {d, d0, d1, 5}];
  TableForm[dat, 
   TableHeadings -> {Style[
        ToString[ToString[NumberForm[100 #, {2, 1}]] <> "%"], Bold, 
        FontFamily -> "Calibri"] & /@ Union@rs, 
     Style[ToString[#], Bold, FontFamily -> "Calibri"] & /@ ds}, 
   TableAlignments -> Right]]

Testing:

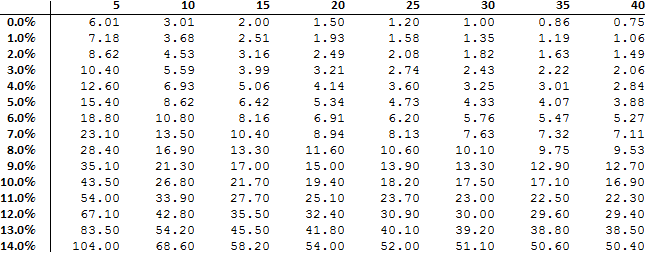
tabf[30, 0.0001, 0.15, 5, 40]

gives:

enter image description here

Apologies for the lazy use of AppendTo (but this is most likely to be small scale).

$\endgroup$

Your Answer

By clicking “Post Your Answer”, you agree to our terms of service and acknowledge you have read our privacy policy.

Not the answer you're looking for? Browse other questions tagged or ask your own question.