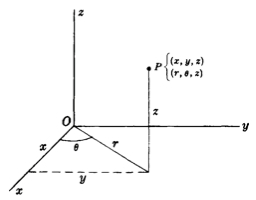
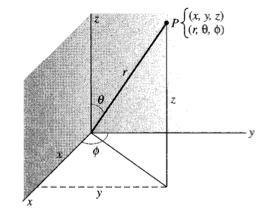
I want to make drawings like these in Mathematica:


I don't know if Mathematica is a gppd solution for drawing such images. If it is, please tell me how to do it; if not, please suggest another solution.
I want to make drawings like these in Mathematica:


I don't know if Mathematica is a gppd solution for drawing such images. If it is, please tell me how to do it; if not, please suggest another solution.
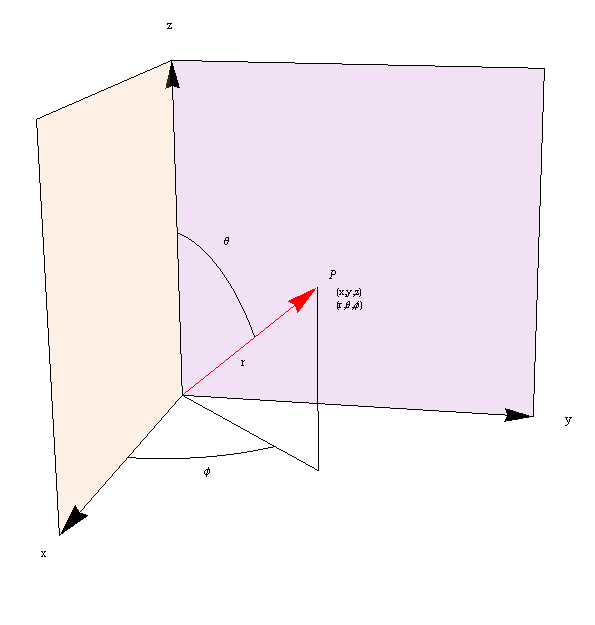
This may be late but I post for illustration:
orig = {0, 0, 0};
axes = {{1, 0, 0}, {0, 1, 0}, {0, 0, 1}};
pt = {0.5, 0.5, 0.5};
arc1 = Table[
   RotationMatrix[j, {0, 0, 1}].{0.5, 0, 0}, {j, 0, Pi/4, 0.01}];
ang = VectorAngle[{0, 0, 1}, {1, 1, 1}];
axis = Cross[{0, 0, 1}, {1, 1, 1}];
arc2 = Table[RotationMatrix[j, axis].{0, 0, 0.5}, {j, 0, ang, 0.01}];
labels = {
  Text[Style["\[Theta]", 12], RotationMatrix[ang/2, axis].{0, 0, 0.6}],
  Text[Style["\[Phi]", 12],
   RotationMatrix[Pi/8, {0, 0, 1}].{0.6, 0, 0}],
  Text[Style[TraditionalForm["r"], 12], (orig + pt)/2 + {0, 0, -0.05}],
  Text[Style["P", Italic, 12], 1.1 pt],
  Text[Column[{"(x,y,z)", "(r,\[Theta],\[Phi])"}],
   1.2 pt - {0, 0, 0.1}],
  MapThread[
   Text[#1, #2] &, {Style[#, 12] & /@ {"x", "y", "z"}, 1.1 axes}]
  }
Assembling into graphic object:
Graphics3D[{Arrow[{orig, #}] & /@ axes, {Red, Arrow[{orig, pt}]},
  Line[{orig, {0.5, 0.5, 0}}], Line[{{0.5, 0.5, 0}, {0.5, 0.5, 0.5}}],
   Line[arc1],
  Line[arc2], {Opacity[0.2],
   Polygon[{orig, {1, 0, 0}, {1, 0, 1}, {0, 0, 1}}]}, {Opacity[0.2],
   Polygon[{orig, {0, 1, 0}, {0, 1, 1}, {0, 0, 1}}]}, labels},
 Boxed -> False]
Does not have all elements (left brace, shading of planes, z on vertical drop) but illustrative.

Bit of manual, but can be a staring point, Arc3D function from How to draw an ellipse arc in 3D?:
Graphics3D[{Arrow[{{0, 0, 0}, #} & /@ {{0, 0, 1}, {0, 1, 0}, {1, 0, 0}}],
 {Dashed, Line[{{.6, 0, 0}, {.6, .6, 0}}]},
 Arc3D[{{.3, 0, 0}, {.3, .3, 0}, {0, 0, 0}}, 30],
 Line[{{.6, .6, 0}, {.6, .6, .6}}],
 {PointSize[Medium], Point[{.6, .6, .6}]},
 Line[{{0, 0, 0}, {.6, .6, 0}}],
 Text[Style["O", Italic, Bold, 13], {0, 0, 0}, {2, -1}],
 Text[Style["x", Italic, Bold, 12], {1, 0, 0}, {-3, 0}],
 Text[Style["y", Italic, Bold, 12], {0, 1, 0}, {-2, 0}],
 Text[Style["z", Italic, Bold, 12], {0, 0, 1}, {-3, 1}]},
 Boxed -> False, PlotRangePadding -> .1]
} at the end.
$\endgroup$