2
$\begingroup$

I have the following problem: I used GraphPlot to plot my adjacency matrix. I divided my nodes in three groups: A = {...}, B={...} and C={...}. I would like to color the nodes conditioning on them belonging to group A (Blue), B (Red), C (Grey). How do I do that?

Example: I have $12$ nodes distributed in three groups as follows: $ A=\{1,4,5,8\}, B=\{2,3,6,7,9,10\},C=\{11,12\}$. I want to color the nodes in $A$ blue, the ones in $B$ red and the ones in $C$ grey. I have of course a $12$x$12$ adjacency matrix $M$ and I use GraphPlot[M] to plot the graph. Thank you.

$\endgroup$
3
  • $\begingroup$ Please include an example $\endgroup$
    – rm -rf
    Commented Oct 3, 2013 at 20:39
  • $\begingroup$ @rm-rf I have just added an example, thank you! $\endgroup$ Commented Oct 3, 2013 at 20:46
  • $\begingroup$ Please look up HighlightGraph and use Graph instead of GraphPlot. There's no built-in function named PlotGraph. If you meant GraphPlot, please make sure that you are precise and you type the correct names in this question. This makes the difference between a working and a non-working command. $\endgroup$
    – Szabolcs
    Commented Oct 3, 2013 at 20:55

2 Answers 2

3
$\begingroup$

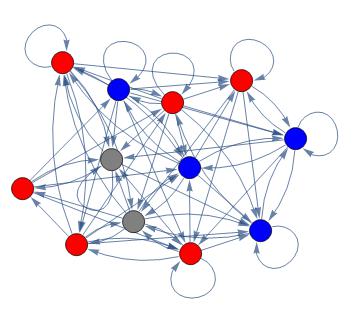
Using the notation Pinguin Dirk you could also use VertexStyle in AdjacencyGraph

aa = {1, 4, 5, 8}; bb = {2, 3, 6, 7, 9, 10}; cc = {11, 12};
vs = Join @@ 
   MapThread[Thread[#1 -> #2] &, {{aa, bb, cc}, {Blue, Red, Gray}}];
mm = RandomChoice[{0, 1}, {12, 12}];
AdjacencyGraph[mm, VertexSize -> 0.4, VertexStyle -> vs]

enter image description here

EDIT

If GraphPlot is what is desired then:

GraphPlot[mm, 
 VertexRenderingFunction -> ({#2 /. vs, Disk[#1, 0.1]} &)]
$\endgroup$
5
$\begingroup$

Let's say you have some random matrix, such as:

mm = RandomChoice[{0, 1}, {12, 12}];

and the lists

aa = {1, 4, 5, 8}; bb = {2, 3, 6, 7, 9, 10}; cc = {11, 12};

Now, GraphPlot can be used to plot an adjacency matrix, (docu: GraphPlot[m] generates a plot of the graph represented by the adjacency matrix m.)

Thus, using in particular, VertexRenderingFunction, we can do:

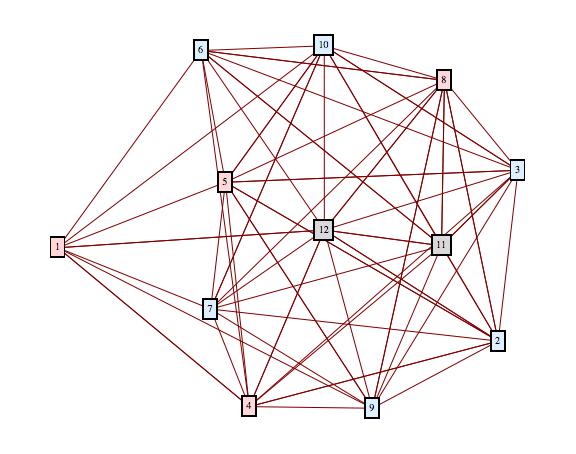
GraphPlot[mm, ImageSize -> Large, 
     VertexRenderingFunction -> (Text[
     Framed[#2, 
         Background -> 
             Which[
               MemberQ[aa, #2], LightRed, 
               MemberQ[bb, #2], LightBlue, 
               MemberQ[cc, #2], LightGray, 
               True, Pink]], #1] &)]

I chose LightRed etc for better readability. Obviously, lot's of formatting can be done from this point to make it look nice.

enter image description here

(a small aside: try not to use single letter upper-case names for variables. E.g. C is already taken by the system)

$\endgroup$

Your Answer

By clicking “Post Your Answer”, you agree to our terms of service and acknowledge you have read our privacy policy.

Not the answer you're looking for? Browse other questions tagged or ask your own question.