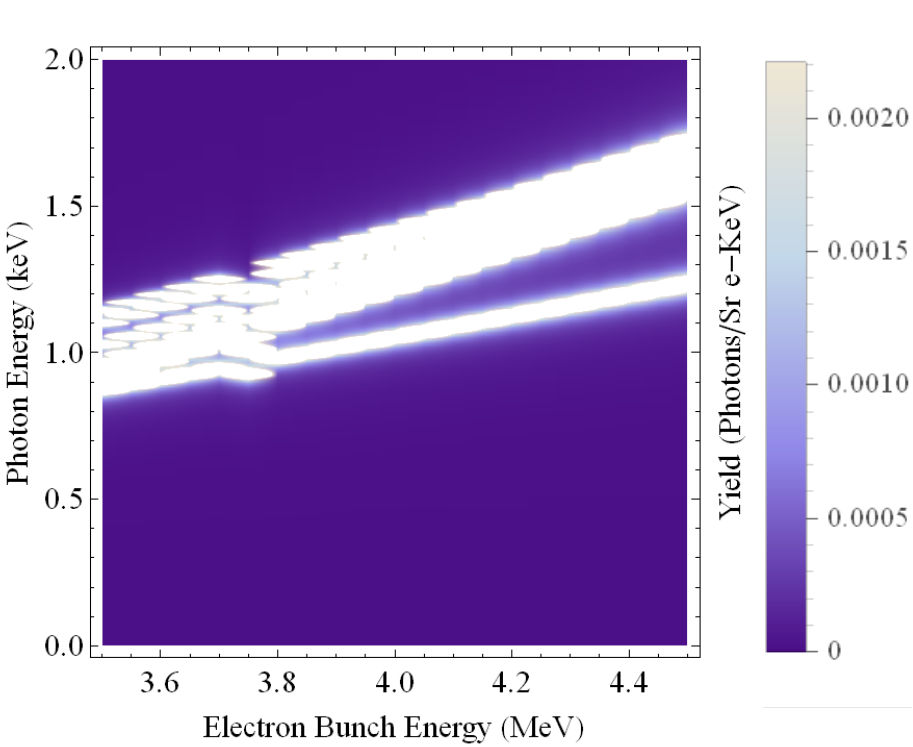
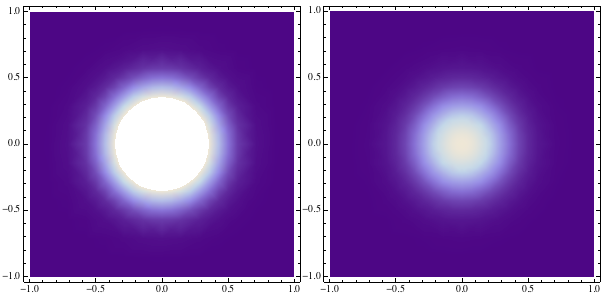
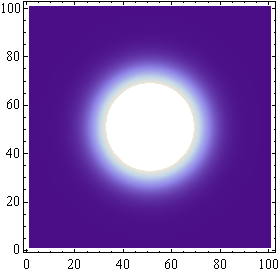
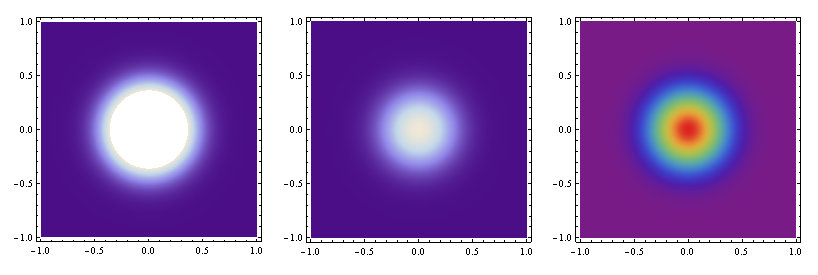
I am making some density and contour plots in Mathematica. These plots have very high peaks which saturate with color and prevent me from seeing differences in the peaks. Is there a way I can tone down the color scale so my peaks are not just white blobs?
Trying other color schemes has not worked out, and playing with the range of color data has not been very useful. Is there some way to have the colors on a log scale???
Here is my code.
ListDensityPlot[photo, PlotLegends -> Automatic, Frame -> {True},
FrameLabel -> {"Electron Bunch Energy (MeV)", "Photon Energy (keV)",
"", "Yield (Photons/Sr e-KeV)" }, LabelStyle -> {15},
InterpolationOrder -> 10]
Cheers, Ben

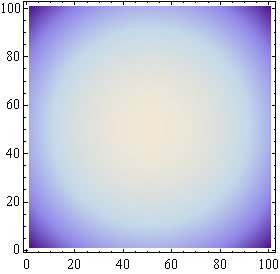
ColorFunctionScaling -> False? $\endgroup$Log[photo]instead? $\endgroup$photodata or something smaller that is representative. $\endgroup${#, #2, Log@#3} & @@@ dataorMapAt[Log, data, {All, 3}]$\endgroup$