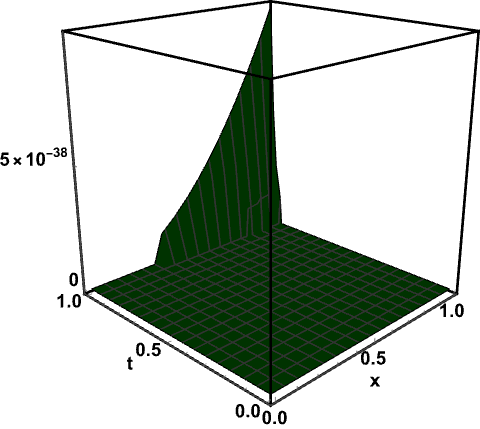
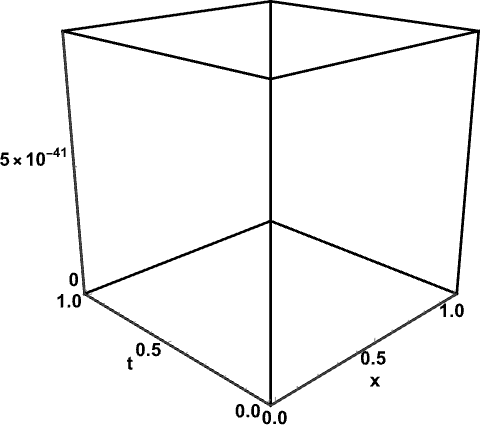
I have a functionR1[x_, t_] = -((t^35 x^2)/10333147966386144929666651337523200000000);
I use the following command in Mathematica to show the graph of Function
pic1 = Plot3D[Abs[R1[x, t]], {x, 0, 1}, {t, 0, 1}, PlotRange -> Full, AxesLabel -> {"x", "t"}, AxesEdge -> {{-1, -1}, {-1, -1}, {-1, 1}}, LabelStyle -> Directive[Black, Bold, 14], BoxStyle -> Directive[Thick, Black, 16], BoxRatios -> {1.5, 1.5, 1.5}, ViewPoint -> {-2, -2, 1}, PlotStyle -> Green]
But when I am using the following Function
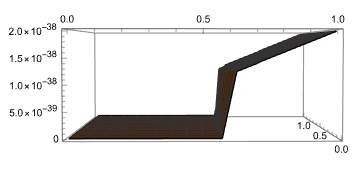
R2[x_, t_] = - ((t^35*x^2)/10333147966386144929666651337523200000);
I have just removed three zero from the denominator, Mathematica gives the Image of function using same code
pic1 = Plot3D[Abs[R2[x, t]], {x, 0, 1}, {t, 0, 1}, PlotRange -> Full,
  AxesLabel -> {"x", "t"}, AxesEdge -> {{-1, -1}, {-1, -1}, {-1, 1}},
  LabelStyle -> Directive[Black, Bold, 14],
  BoxStyle -> Directive[Thick, Black, 16],
  BoxRatios -> {1.5, 1.5, 1.5}, ViewPoint -> {-2, -2, 1},
  PlotStyle -> Green]
The Image of Second Function is

How we obtain the Image of 1st Function. I am using Mathematica 13.3.1


Table[Abs[R1[x, t]], {x, 0, 1, .1}, {t, 0, 1, .1}] // Chopthen you will see why. It is all zeros i.sstatic.net/ophxcsA4.png it looks like you hit a thresh hold on what Plot3D can show in terms of how small the values can be. For your R2 you did not hit this limit. $\endgroup$Plot3D[1000*Abs[R1[x, t]], {x, 0, 1}, {t, 0, 1}, PlotRange -> All]and now it shows plot. $\endgroup$Logscaling. $\endgroup$