14
$\begingroup$

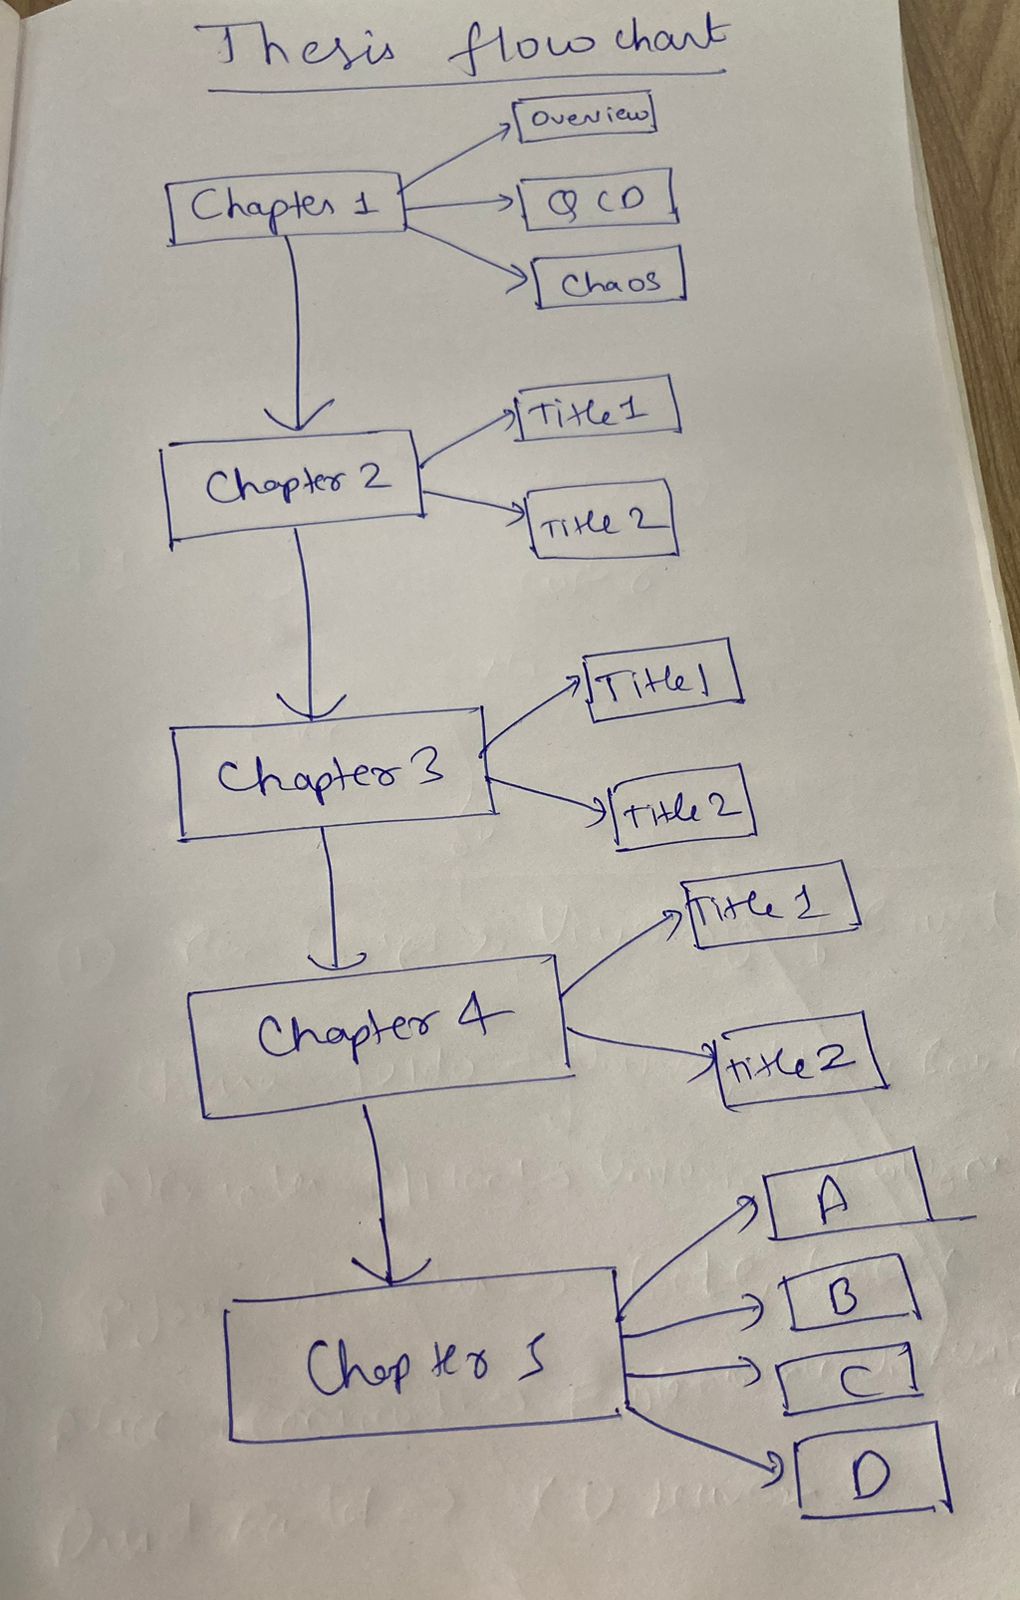
I wish to create a Thesis flowchart which has to look something like this:

flowchart

I am a beginner with Mathematica Graphics features, so I tried using the Graph functionality to generate a skeleton for my thesis flowchart using the following code:

nodes = {"Chapter 1", "Chapter 2", "Chapter 3", "Chapter 4", 
   "Chapter 5"};

edges = {DirectedEdge["Chapter 1", "Chapter 2"], 
   DirectedEdge["Chapter 2", "Chapter 3"], 
   DirectedEdge["Chapter 3", "Chapter 4"], 
   DirectedEdge["Chapter 4", "Chapter 5"]};

flowchart = 
 Graph[nodes, edges, VertexLabels -> Placed["Name", Center], 
  VertexShapeFunction -> "Rectangle", VertexSize -> 0.7, 
  EdgeStyle -> Arrowheads[Medium], 
  GraphLayout -> "LayeredDigraphEmbedding" ]

How can I finish what I have in mind using advanced graphic features in Mathematica?

Any help in this regard would be truly beneficial!

$\endgroup$
2

3 Answers 3

17
$\begingroup$

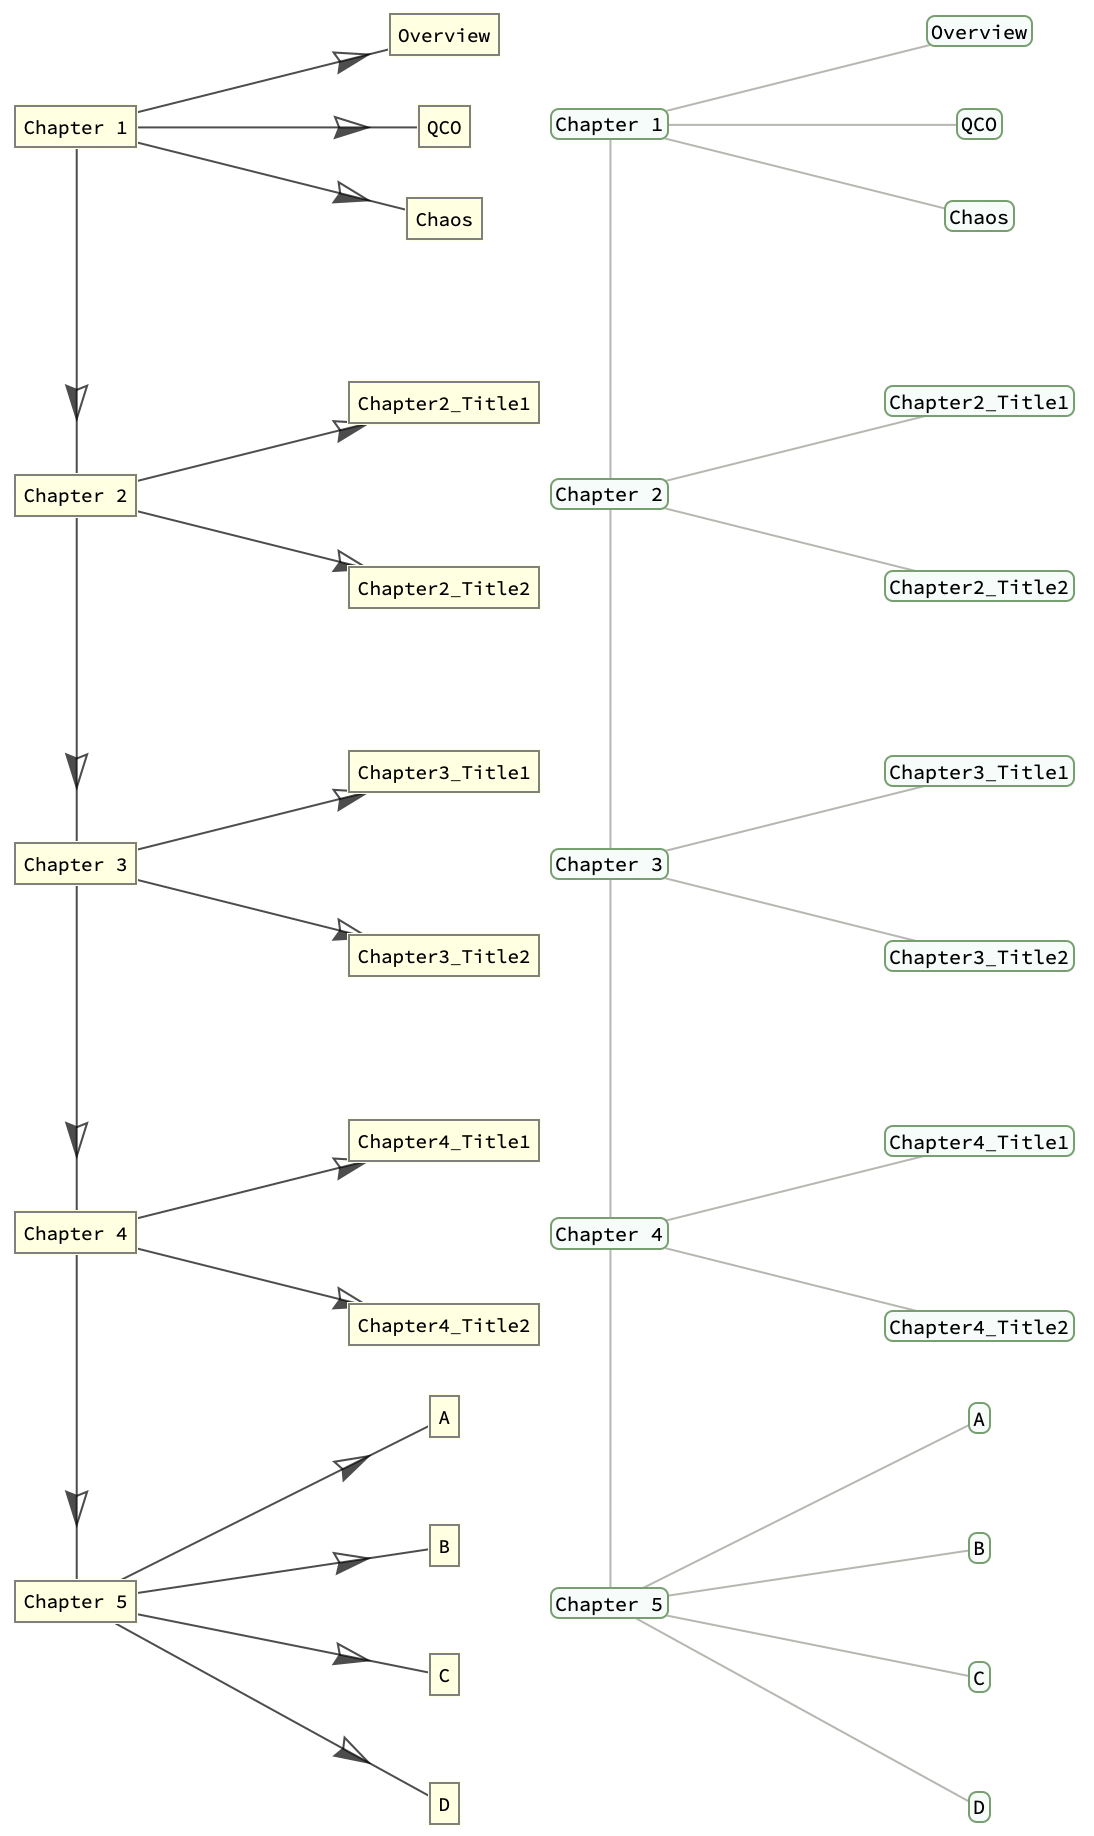
Here is something fun based on, regretfully, an undocumented DynamicLocation feature:

data = <|
  "Chapter 1" -> {"Overview", "QCO", "Chaos"},
  "Chapter 2" -> {"Chapter2_Title1", "Chapter2_Title2"},
  "Chapter 3" -> {"Chapter3_Title1", "Chapter3_Title2"},
  "Chapter 4" -> {"Chapter4_Title1", "Chapter4_Title2"},
  "Chapter 5" -> {"A", "B", "C"}
  |>
chapters = Keys @ data;

vertexShape = DynamicName[Framed[#, RoundingRadius -> 5], #] &;

stdLayout = Grid[
   {
      vertexShape@#, Column[vertexShape /@ data[#], Spacings -> 1]
      } & /@ chapters
   , Spacings -> {10, 2}
   , Alignment -> Left
];

edges = {
   (*chapter flow*)
   Arrow[DynamicLocation[#, Automatic] & /@ #] & /@ Partition[chapters, 2, 1],
   (*chapter parts*)
   Arrow[
      {DynamicLocation[#, Automatic, Right], DynamicLocation[#2, Automatic, Left]}
   ] & @@@ Flatten[Thread /@ Normal@data]
};


size = Rasterize[stdLayout, "RasterSize"] *(72/96.)*(4/5);

DynamicNamespace[
 Graphics[
   { Inset @ stdLayout,  edges }
  , ImageSize -> size
  , DefaultBaseStyle -> {}
  , AspectRatio -> Full
  , Frame -> False
  , PlotRangePadding -> None
  , ImageMargins -> 0
  , BaseStyle -> {CacheGraphics -> False}
  , FormatType -> StandardForm
  ]
 ]

enter image description here

$\endgroup$
6
  • $\begingroup$ Thank you for such an elegant answer :) . Just a typo; I think there should be stdLayout instead of grid in size = Rasterize[grid, "RasterSize"] $\endgroup$
    – codebpr
    Commented Nov 22 at 11:58
  • $\begingroup$ @codebpr Thanks, and thanks indeed. $\endgroup$
    – Kuba
    Commented Nov 22 at 11:59
  • $\begingroup$ Is there a way to make it more appealing by adding colours? Also, can we increase the rectangle size if the Chapter Title is too long, which we can break in more than one line, and also change the fonts if needed? $\endgroup$
    – codebpr
    Commented Nov 22 at 12:39
  • 1
    $\begingroup$ Sure, For vertices the Framed can be whatever, it can also have a fixed/max width to make linebreaks. You can add FrameStyle etc. For edges, you can add Arrow styling options like you would to to a regular Graphics. @codebpr $\endgroup$
    – Kuba
    Commented Nov 22 at 12:54
  • 1
    $\begingroup$ It seems like Alignment -> Left option is missed in Grid? $\endgroup$
    – halmir
    Commented Nov 22 at 16:41
7
$\begingroup$

I did not do anything manually - I simply uploaded your image to https://claude.ai and asked a few questions. For me most important thing is nice wrapping of labels around text which I saw in Tree[]. It shrink-wraps frames of labels nicely around text so it is automatic and no manual specifications for the frames is not needed. Code is under the image. But you can do this with Graph[] too. I give code for both.

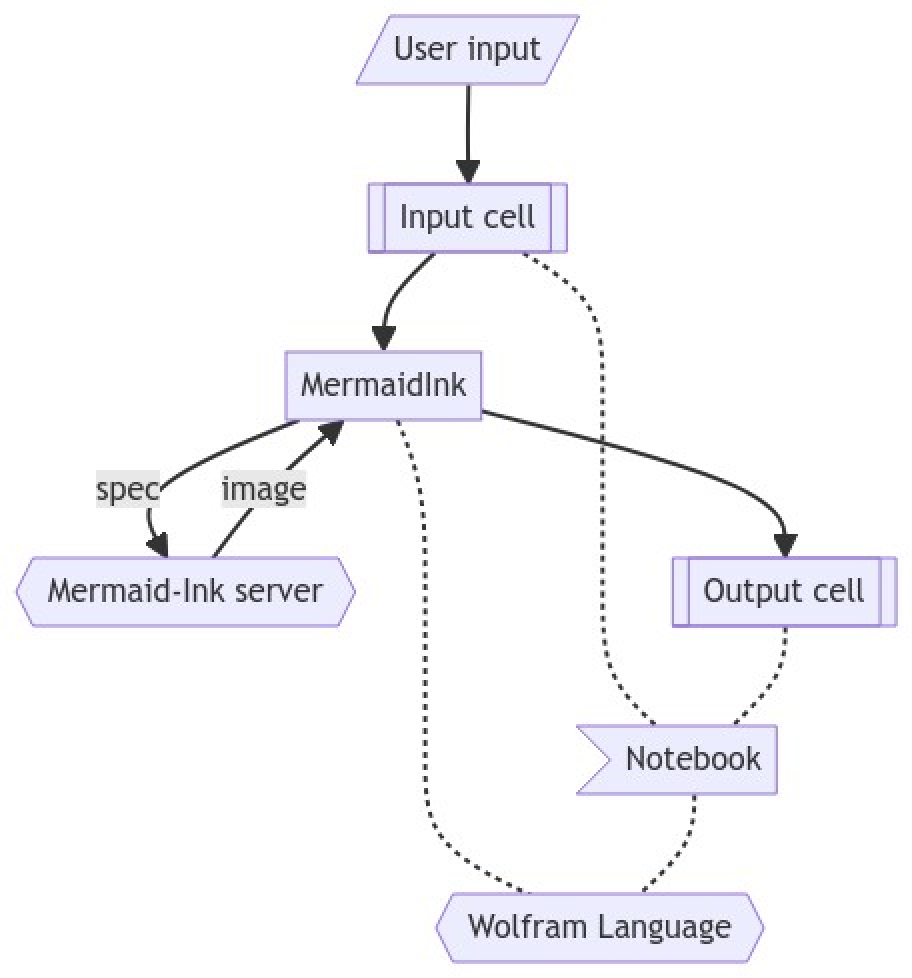
Also for the future consider MermaidInk but it might be less flexible, not sure, needs check:

https://resources.wolframcloud.com/FunctionRepository/resources/MermaidInk
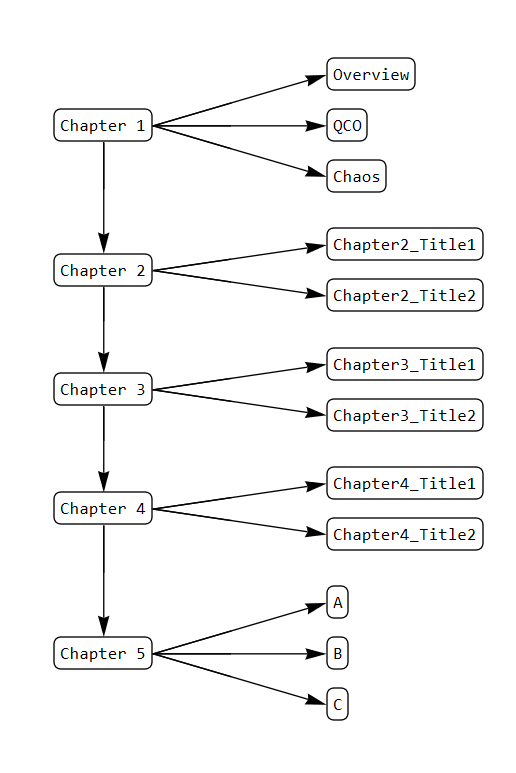
enter image description here


Final plots


enter image description here

Graph

Structure data:

data={
    "Chapter 1" -> "Overview",
    "Chapter 1" -> "QCO",
    "Chapter 1" -> "Chaos",
    "Chapter 1" -> "Chapter 2",
    "Chapter 2" -> "Chapter2_Title1",
    "Chapter 2" -> "Chapter2_Title2",
    "Chapter 2" -> "Chapter 3",
    "Chapter 3" -> "Chapter3_Title1",
    "Chapter 3" -> "Chapter3_Title2",
    "Chapter 3" -> "Chapter 4",
    "Chapter 4" -> "Chapter4_Title1",
    "Chapter 4" -> "Chapter4_Title2",
    "Chapter 4" -> "Chapter 5",
    "Chapter 5" -> "A",
    "Chapter 5" -> "B",
    "Chapter 5" -> "C",
    "Chapter 5" -> "D"
};

Label coordinates data:

coor= {
    "Chapter 1" -> {100, 500},
    "Overview" -> {200, 525},
    "QCO" -> {200, 500},
    "Chaos" -> {200, 475},
    "Chapter 2" -> {100, 400},
    "Chapter2_Title1" -> {200, 425},
    "Chapter2_Title2" -> {200, 375},
    "Chapter 3" -> {100, 300},
    "Chapter3_Title1" -> {200, 325},
    "Chapter3_Title2" -> {200, 275},
    "Chapter 4" -> {100, 200},
    "Chapter4_Title1" -> {200, 225},
    "Chapter4_Title2" -> {200, 175},
    "Chapter 5" -> {100, 100},
    "A" -> {200, 150},
    "B" -> {200, 115},
    "C" -> {200, 80},
    "D" -> {200, 45}
};

Define a special graph with nice frames around labels:

ClearAll@LabeledGraph;
LabeledGraph[data_, opts:OptionsPattern[]] :=
    Block[{g, vfunc},
        g = Graph[data, VertexLabels->Automatic];
        vfunc=(# -> With[{lab = #},
        Inset[Framed[Style[lab, "StandardForm", "Output", FontColor -> Black,FontSize -> Scaled[0.05]],
          Background -> RGBColor[1., 1., 0.871], FrameStyle -> GrayLevel[0.5]], #1]&]&)/@VertexList[g];
       Graph[VertexList[g], EdgeList[g], VertexShapeFunction -> vfunc, opts, EdgeStyle -> Black]
    ]

Use it with your data:

LabeledGraph[data, VertexCoordinates -> coor, 
 EdgeShapeFunction -> {{"CarvedArrow", "ArrowSize" -> .1}}]

Tree

Tree["Chapter 1", {
    Tree["Overview", {}],
    Tree["QCO", {}],
    Tree["Chaos", {}],
    Tree["Chapter 2", {
        Tree["Chapter2_Title1", {}],
        Tree["Chapter2_Title2", {}],
        Tree["Chapter 3", {
            Tree["Chapter3_Title1", {}],
            Tree["Chapter3_Title2", {}],
            Tree["Chapter 4", {
                Tree["Chapter4_Title1", {}],
                Tree["Chapter4_Title2", {}],
                Tree["Chapter 5", {
                    Tree["A", {}],
                    Tree["B", {}],
                    Tree["C", {}],
                    Tree["D", {}]
                }]
            }]
        }]
    }]
},
TreeElementCoordinates -> {
    {} -> {100, 500},                    (* Chapter 1 *)
    {1} -> {200, 525},                   (* Overview *)
    {2} -> {200, 500},                   (* QCO *)
    {3} -> {200, 475},                   (* Chaos *)
    {4} -> {100, 400},                   (* Chapter 2 *)
    {4, 1} -> {200, 425},                (* Chapter2_Title1 *)
    {4, 2} -> {200, 375},                (* Chapter2_Title2 *)
    {4, 3} -> {100, 300},                (* Chapter 3 *)
    {4, 3, 1} -> {200, 325},             (* Chapter3_Title1 *)
    {4, 3, 2} -> {200, 275},             (* Chapter3_Title2 *)
    {4, 3, 3} -> {100, 200},             (* Chapter 4 *)
    {4, 3, 3, 1} -> {200, 225},          (* Chapter4_Title1 *)
    {4, 3, 3, 2} -> {200, 175},          (* Chapter4_Title2 *)
    {4, 3, 3, 3} -> {100, 100},          (* Chapter 5 *)
    {4, 3, 3, 3, 1} -> {200, 150},       (* A *)
    {4, 3, 3, 3, 2} -> {200, 115},       (* B *)
    {4, 3, 3, 3, 3} -> {200, 80},        (* C *)
    {4, 3, 3, 3, 4} -> {200, 45}         (* D *)
}]
$\endgroup$
5
$\begingroup$
text = {
   "Chapter 5", "Chapter 4", "Chapter 3", "Chapter 2", "Chapter 1",
   "D", "C", "B", "A",
   "title 2", "title 1",
   "title 2", "title 1",
   "title 2", "title 1",
   "Chaos", "QCD", "overview"
   };
arr[pt_] := 
  Module[{pts, l}, 
   pts = MeshCoordinates@
     DiscretizeGraphics@ResourceFunction["RoundedPolygon"][pt, 0.1];
   l = Partition[pts, Length@pts/Length@pt];
   Join[{Last@l[[1]]}, l[[2]], {First@l[[3]]}]];
Module[{pts, rr, coord, coords, acoords}, rr = .1; 
 pts = RotationTransform[Pi/3][#] & /@ CirclePoints[3];
 coord = {{{0, 0}, {3, 1}}, {{0, 3}, {3, 4}}, {{0, 6}, {3, 7}}, {{0, 
     9}, {3, 10}}, {{0, 12}, {3, 
     13}}, {{4.5, -1.5}, {5.5, -0.75}}, {{4.5, -0.5}, {5.5, 
     0.25}}, {{4.5, 0.5}, {5.5, 1.25}}, {{4.5, 1.5}, {5.5, 
     2.25}}, {{4.5, 2.625}, {5.5, 3.375}}, {{4.5, 3.625}, {5.5, 
     4.375}}, {{4.5, 5.625}, {5.5, 6.375}}, {{4.5, 6.625}, {5.5, 
     7.375}}, {{4.5, 8.625}, {5.5, 9.375}}, {{4.5, 9.625}, {5.5, 
     10.375}}, {{4.5, 11.125}, {5.5, 11.875}}, {{4.5, 12.125}, {5.5, 
     12.875}}, {{4.5, 13.125}, {5.5, 13.875}}};
 coords = (Mean /@ Thread@#) & /@ coord;
 acoords = {{{3, 0.5}, {4.5, 15/8}}, {{3, 0.5}, {4.5, 0.875}}, 
    {{3, 0.5}, {4.5, -1/8}}, {{3, 0.5}, {4.5, -9/8}}, 
    {{3, 3.5625}, {4.5, 4.}}, {{3, 3.5625}, {4.5, 3}}, 
    {{3, 6.5625}, {4.5, 7.}}, {{3, 6.5625}, {4.5, 6}}, 
    {{3, 9.5625}, {4.5, 10.}}, {{3, 9.5625}, {4.5, 9}}, 
    {{3, 12.5625}, {4.5, 13.5}}, {{3, 12.5625}, {4.5, 25/2}}, 
    {{3, 12.5625}, {4.5, 23/2}}, {{1.5, 12}, {1.5, 10}}, {{1.5, 
     9}, {1.5, 7}}, {{1.5, 6}, {1.5, 4}}, {{1.5, 3}, {1.5, 1}}};
 Graphics[{
   EdgeForm[Black], FaceForm[White],
   Arrowheads[{0, .04}],
   Arrow[Line@#] & /@ acoords,
   Rectangle[#, #2, RoundingRadius -> rr] & @@@ coord,
   Text[#, #2] & @@@ Thread[{text, coords}]
   }, ImageSize -> 300, Background -> White, Axes -> False]
 ]

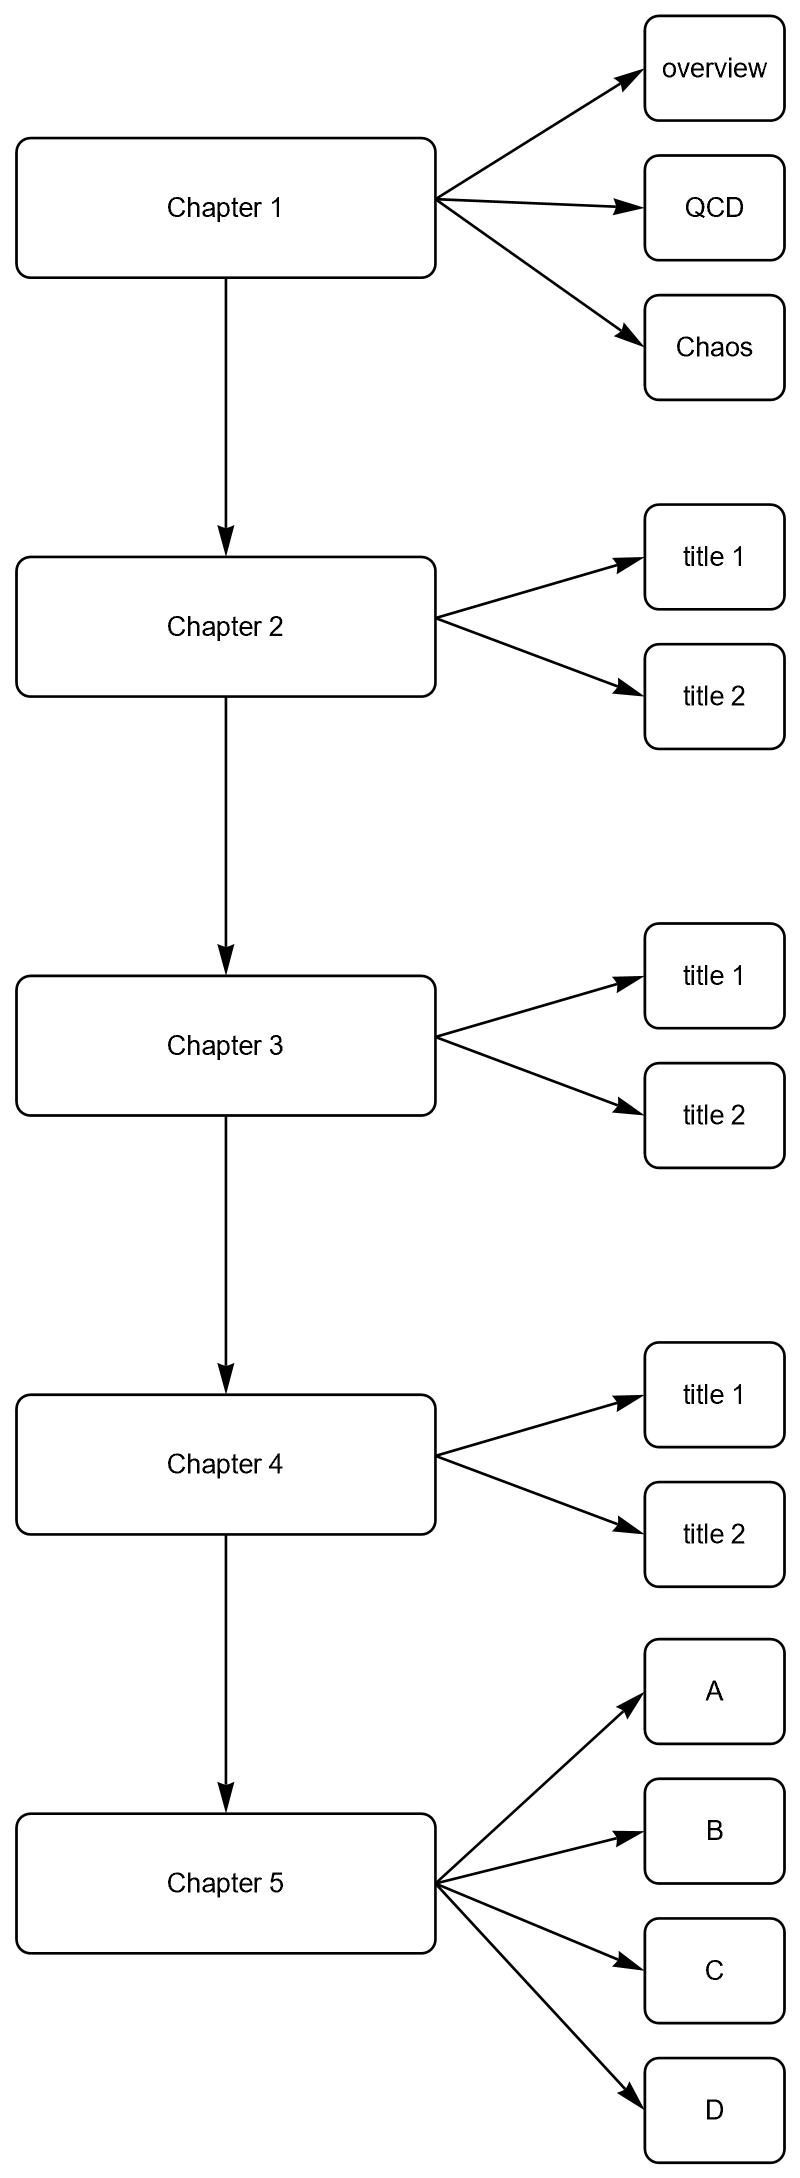
enter image description here

$\endgroup$

Your Answer

By clicking “Post Your Answer”, you agree to our terms of service and acknowledge you have read our privacy policy.

Not the answer you're looking for? Browse other questions tagged or ask your own question.