1
$\begingroup$

I have a question for system of ordinary differential equations, because Mathematica does not give the solution. To be more specific, it does not give any sign that there is some problem. There is the code:

s = NDsolve[{
  y1'[x] == y4[x]*Sin[y3[x]]/Sin[y2[x]] + y5[x]*Cos[y3[x]]/Sin[y2[x]],
  y2'[x] == y4[x]*Cos[y3[x]]y5[x]*Sin[y3[x]],
  y3'[x] == y4[x]*Sin[y3[x]]*Cos[y2[x]]/Sin[y2[x]] - y5[x]*Cos[y3[x]]*Cos[y2[x]]/Sin[y2[x]],
  y4'[x] == (Mo1 - (Jo3 - Jo2)*y6[x]*y5[x])/Jo1,
  y5'[x] == (Mo2 - (Jo1 - Jo3)*y4[x]*y6[x])/Jo2,
  y6'[x] == (Mo3 - (Jo2 - Jo1)*y5[x]*y4[x])/Jo3,
  y1[0] == 0, y2[0] == 0, y3[0] == 0, y4[0] == 0,
  y5[0] == 0,y6[0] == 0}, {y1, y2, y3, y4, y5, y6}, {x, 20}]

So if someone have any advice it would help.

$\endgroup$
1
  • 5
    $\begingroup$ First of all, it is NDSolve and not NDsolve. ALso I see no numerical values for Jo1 and Jo2 and all the Mos there? Also, since you are dividing by dependent variables in many places, and your IC's are zero, you will get 1/0 errors. $\endgroup$
    – Nasser
    Commented Jul 9 at 13:30

2 Answers 2

3
$\begingroup$

Here is an example that actually runs without messages, fixing a number of errors in @zeraoulia rafik's code and adjusting parameter values to make a nice plot:

(*Define parameters*)
Mo1 = 2/5;
Mo2 = 2/5;
Mo3 = 2/5;
Jo1 = 1/5;
Jo2 = 2/5;
Jo3 = 3/5;

(*Define the system of ODEs*)
eqns = {
   y1'[x] == y4[x]*Sin[y3[x]]/Sin[y2[x]] + y5[x]*Cos[y3[x]]/Sin[y2[x]],
   y2'[x] == y4[x]*Cos[y3[x]]*y5[x]*Sin[y3[x]],
   y3'[x] == y4[x]*Sin[y3[x]]*Cos[y2[x]]/Sin[y2[x]] -
     y5[x]*Cos[y3[x]]*Cos[y2[x]]/Sin[y2[x]],
   y4'[x] == (Mo1 - (Jo3 - Jo2)*y6[x]*y5[x])/Jo1,
   y5'[x] == (Mo2 - (Jo1 - Jo3)*y4[x]*y6[x])/Jo2,
   y6'[x] == (Mo3 - (Jo2 - Jo1)*y5[x]*y4[x])/Jo3};

(* Initial conditions *)
initialConditions = {
  y1[0] == 3, y2[0] == 1, y3[0] == 2, y4[0] == 1, y5[0] == 2, y6[0] == 1};

(*Variables*)
vars = {y1, y2, y3, y4, y5, y6};

ListLinePlot[
 NDSolveValue[
  {eqns, initialConditions}
  , vars, {x, 0, 20}
  , WorkingPrecision -> 32
  , PrecisionGoal -> 8]
 , PlotLegends -> vars]
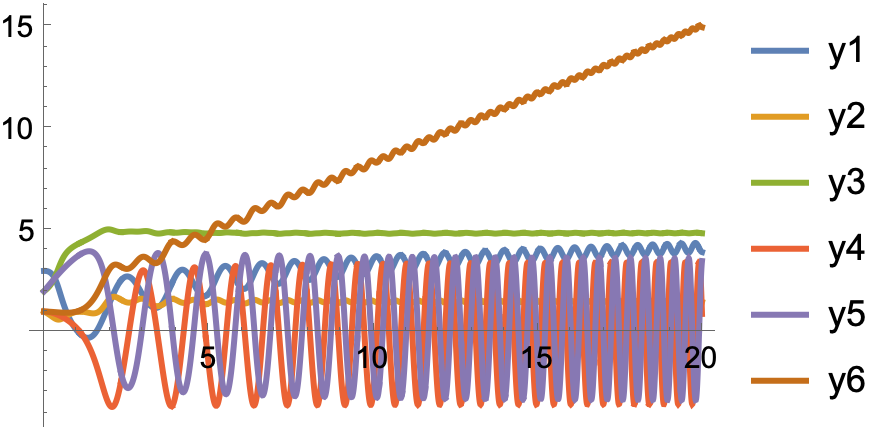
plot showing oscillating values of the y variables


Another approach to the problem as given:

psol = ParametricNDSolveValue[{
    ode = {
      y1'[x] == 
       y4[x]*Sin[y3[x]]/Sin[y2[x]] + y5[x]*Cos[y3[x]]/Sin[y2[x]],
      y2'[x] == y4[x]*Cos[y3[x]] y5[x]*Sin[y3[x]],
      y3'[x] == y4[x]*Sin[y3[x]]*Cos[y2[x]]/Sin[y2[x]] -
        y5[x]*Cos[y3[x]]*Cos[y2[x]]/Sin[y2[x]],
      y4'[x] == (mo1 - (jo3 - jo2)*y6[x]*y5[x])/jo1,
      y5'[x] == (mo2 - (jo1 - jo3)*y4[x]*y6[x])/jo2,
      y6'[x] == (mo3 - (jo2 - jo1)*y5[x]*y4[x])/jo3}
    , ics = {
      y1[0] == y10, y2[0] == y20, y3[0] == y30,
      y4[0] == y40, y5[0] == y50, y6[0] == y60}
    }, vars = {y1, y2, y3, y4, y5, y6}
   , {x, 0, 20}
   , params = {
       mo1, mo2, mo3, jo1, jo2, jo3,
       y10, y20, y30, y40, y50, y60}];

ListLinePlot[
 psol[2/5, 2/5, 2/5, 1/5, 2/5, 3/5, 3, 1, 2, 1, 2, 1], 
 PlotLegends -> vars]
(* same plot as above *)
$\endgroup$
-1
$\begingroup$

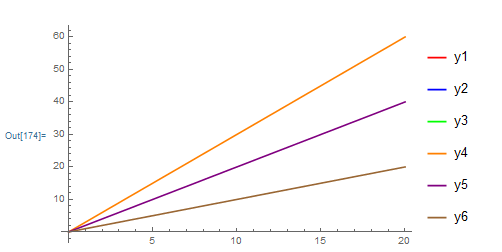
According to the recommendations given by @Nasser in the comment above, I have tried to show your solutions by adding the missing numerical values for your parameters and initial condition values. I have obtained the following different numerical solutions,Here is the improved code:

(*Define parameters*)Mo1 = 3;
Mo2 = 2;
Mo3 = 1;
Jo1 = 1;
Jo2 = 1;
Jo3 = 1;

(*Define the system of ODEs*)
eqns = {y1'[x] == 
    y4[x]*Sin[y3[x]]/Sin[y2[x]] + y5[x]*Cos[y3[x]]/Sin[y2[x]], 
   y2'[x] == y4[x]*Cos[y3[x]]*y5[x]*Sin[y3[x]], 
   y3'[x] == 
    y4[x]*Sin[y3[x]]*Cos[y2[x]]/Sin[y2[x]] - 
     y5[x]*Cos[y3[x]]*Cos[y2[x]]/Sin[y2[x]], 
   y4'[x] == (Mo1 - (Jo3 - Jo2)*y6[x]*y5[x])/Jo1, 
   y5'[x] == (Mo2 - (Jo1 - Jo3)*y4[x]*y6[x])/Jo2, 
   y6'[x] == (Mo3 - (Jo2 - Jo1)*y5[x]*y4[x])/Jo3};

(*Initial conditions*)
initialConditions = {y1[0] == 0, y2[0] == 0, y3[0] == 0, y4[0] == 0, 
   y5[0] == 0, y6[0] == 0};

(*Variables*)
vars = {y1, y2, y3, y4, y5, y6};

(*Define colors for each plot*)
colors = {Red, Blue, Green, Orange, Purple, Brown};

(*Solve each equation individually and plot*)
plots = Table[
   Module[{sol}, 
    sol = NDSolve[{eqns[[n]], initialConditions[[n]]}, 
      vars[[n]], {x, 0, 20}, Method -> "StiffnessSwitching"];
    Plot[Evaluate[vars[[n]][x] /. sol], {x, 0, 20}, PlotRange -> All, 
     PlotStyle -> colors[[n]], 
     PlotLegends -> {ToString[vars[[n]]]}]], {n, Length[eqns]}];

Show[plots]

enter image description here

$\endgroup$
1
  • 1
    $\begingroup$ This is nothing like correct working code. Whoever upvoted obviously didn't try it. Was this answer produced by ChatGPT? (-1) $\endgroup$
    – Michael E2
    Commented Jul 9 at 21:25

Your Answer

By clicking “Post Your Answer”, you agree to our terms of service and acknowledge you have read our privacy policy.

Not the answer you're looking for? Browse other questions tagged or ask your own question.