3
$\begingroup$

I am trying to fit this data set into a specific sinusoidal equation.

The equation is shown like this.

modelR2w =  y1 + DL Cos [ \[Phi] + a2 ] +  FL (2 (Cos[\[Phi] + a2]^3) - Cos[\[Phi] + a2]);

And the codes are following like,


DataR2w = Transpose[{Flatten[{dataPhi}], Flatten[{dataR2w}]}];

modelR2w =  y1 + DL Cos [ \[Phi] + a2 ] +  FL (2 (Cos[\[Phi] + a2]^3) - Cos[\[Phi] + a2]);

fit2 = FindFit[DataR2w, modelR2w, {y1, a2, DL, FL}, \[Phi]]

modelf2 = Function[{\[Phi]}, Evaluate[modelR2w /. fit2]]

Plot[modelf2[\[Phi]], {\[Phi], 0, 2 Pi}, Epilog -> Map[Point, DataR2w]]

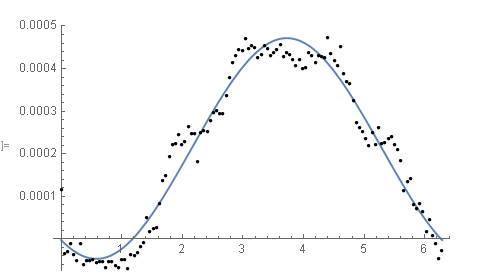
I use Findfit to find out the parameters, and it works well when the data is shown like this,

enter image description here

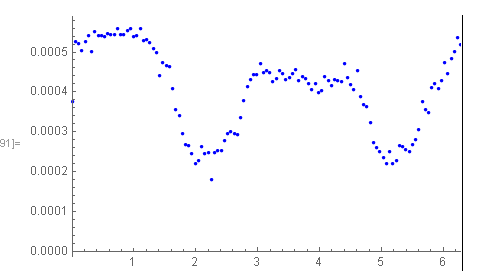
However, when the data is out of the figures, that is, $Cos[phi]$ graph,

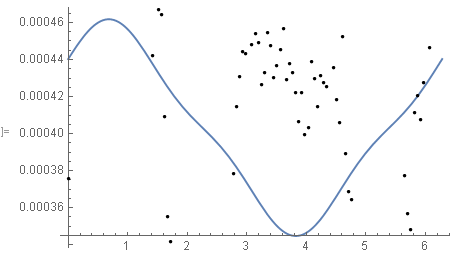
It does not work well...

enter image description here

enter image description here

Actually, the equation consists of two terms; $cos(phi)$ and $2(cos(phi))^3-cos(phi)$

I think this Findfit is not good with $2(cos(phi))^3-cos(phi)$

Could you give me some advice on how to overcome this problem?

I am trying to find the fitted one with Nonlinearfit.....

Thank you in advance, and if you need any raw data, I shall send you immediately.


I added my actual data and Wolfram notebook file.

1) https://docs.google.com/spreadsheets/d/1zYiXrT1l6tgH1d0DNBVCt2iNbVX9tNhq/edit?usp=drive_link&ouid=104846936799445912159&rtpof=true&sd=true,

2) https://drive.google.com/file/d/1dYGqX3Ugs0MaqNVMMHNwV3VMH3Z8AXV9/view?usp=drive_link,

3) https://docs.google.com/spreadsheets/d/1jAdNLq0Kr6ChNMIlwGLHns2sDqwh_Hhx/edit?usp=drive_link&ouid=104846936799445912159&rtpof=true&sd=true,

4) https://docs.google.com/spreadsheets/d/1zDlMJ1pAzO2S2Lhhj1469fUv_nHPc6k_/edit?usp=drive_link&ouid=104846936799445912159&rtpof=true&sd=true

$\endgroup$
4
  • 4
    $\begingroup$ Please edit your question to include your data or a link to where it can be downloaded. $\endgroup$
    – Bob Hanlon
    Commented Feb 29 at 1:24
  • $\begingroup$ Thank you for your kindness. I added 4 files consisting of Wolfram and excel data. If there is any trouble to download files, please let me know. Thank you very much! $\endgroup$
    – JS LEE
    Commented Feb 29 at 5:53
  • $\begingroup$ Is there a data error for the first observation in R1w: 0.0459 ? The rest of the data in Rw1 looks too perfect for what I encounter with biological data. Is that from a model prediction? Also, the 3 figures shown appear to be 3 different datasets and it appears you've only given the data for the middle figure. Am I misinterpreting your information? $\endgroup$
    – JimB
    Commented Mar 1 at 17:01
  • $\begingroup$ Is there a restriction in the parameters of the model such that the value of the model is the same at $\phi=0$ and $\phi=2\pi$? $\endgroup$
    – JimB
    Commented Mar 1 at 17:25

2 Answers 2

3
$\begingroup$

As Sin[w x + phi] are a complete system, you may make a fit with a few such functions.

Given the data:

xs = {0, 0.05236, 0.10472, 0.15708, 0.20944, 0.2618, 0.31416, 0.36652,
    0.41888, 0.47124, 0.5236, 0.57596, 0.62832, 0.68068, 0.73304, 
   0.7854, 0.83776, 0.89012, 0.94248, 0.99484, 1.0472, 1.09956, 
   1.15192, 1.20428, 1.25664, 1.309, 1.36136, 1.41372, 1.46608, 
   1.51844, 1.5708, 1.62316, 1.67552, 1.72788, 1.78024, 1.8326, 
   1.88496, 1.93732, 1.98968, 2.04204, 2.0944, 2.14675, 2.19911, 
   2.25147, 2.30383, 2.35619, 2.40855, 2.46091, 2.51327, 2.56563, 
   2.61799, 2.67035, 2.72271, 2.77507, 2.82743, 2.87979, 2.93215, 
   2.98451, 3.03687, 3.08923, 3.14159, 3.19395, 3.24631, 3.29867, 
   3.35103, 3.40339, 3.45575, 3.50811, 3.56047, 3.61283, 3.66519, 
   3.71755, 3.76991, 3.82227, 3.87463, 3.92699, 3.97935, 4.03171, 
   4.08407, 4.13643, 4.18879, 4.24115, 4.29351, 4.34587, 4.39823, 
   4.45059, 4.50295, 4.55531, 4.60767, 4.66003, 4.71239, 4.76475, 
   4.81711, 4.86947, 4.92183, 4.97419, 5.02655, 5.07891, 5.13127, 
   5.18363, 5.23599, 5.28835, 5.34071, 5.39307, 5.44543, 5.49779, 
   5.55015, 5.60251, 5.65487, 5.70723, 5.75959, 5.81195, 5.86431, 
   5.91667, 5.96903, 6.02139, 6.07375, 6.12611, 6.17847, 6.23083, 
   6.28319};
ys = {4.59 E - 02, 6.05 E - 02, 6.36 E - 02, 6.64 E - 02, 6.91 E - 02,
    7.16 E - 02, 7.39 E - 02, 7.59 E - 02, 7.77 E - 02, 7.92 E - 02, 
   8.06 E - 02, 8.15 E - 02, 8.21 E - 02, 8.23 E - 02, 8.23 E - 02, 
   8.18 E - 02, 8.12 E - 02, 8.02 E - 02, 7.88 E - 02, 7.72 E - 02, 
   7.52 E - 02, 7.30 E - 02, 7.05 E - 02, 6.78 E - 02, 6.50 E - 02, 
   6.18 E - 02, 5.86 E - 02, 5.52 E - 02, 5.17 E - 02, 4.84 E - 02, 
   4.50 E - 02, 4.17 E - 02, 3.83 E - 02, 3.50 E - 02, 3.19 E - 02, 
   2.88 E - 02, 2.62 E - 02, 2.36 E - 02, 2.12 E - 02, 1.91 E - 02, 
   1.73 E - 02, 1.59 E - 02, 1.47 E - 02, 1.39 E - 02, 1.33 E - 02, 
   1.31 E - 02, 1.33 E - 02, 1.38 E - 02, 1.46 E - 02, 1.59 E - 02, 
   1.71 E - 02, 1.84 E - 02, 2.03 E - 02, 2.19 E - 02, 2.41 E - 02, 
   2.67 E - 02, 2.92 E - 02, 3.21 E - 02, 3.50 E - 02, 3.81 E - 02, 
   4.13 E - 02, 4.47 E - 02, 4.79 E - 02, 5.11 E - 02, 5.42 E - 02, 
   5.75 E - 02, 6.04 E - 02, 6.34 E - 02, 6.59 E - 02, 6.84 E - 02, 
   7.06 E - 02, 7.25 E - 02, 7.42 E - 02, 7.57 E - 02, 7.67 E - 02, 
   7.75 E - 02, 7.79 E - 02, 7.81 E - 02, 7.78 E - 02, 7.74 E - 02, 
   7.65 E - 02, 7.53 E - 02, 7.40 E - 02, 7.24 E - 02, 7.04 E - 02, 
   6.84 E - 02, 6.61 E - 02, 6.36 E - 02, 6.10 E - 02, 5.81 E - 02, 
   5.52 E - 02, 5.24 E - 02, 4.96 E - 02, 4.68 E - 02, 4.40 E - 02, 
   4.13 E - 02, 3.88 E - 02, 3.64 E - 02, 3.43 E - 02, 3.23 E - 02, 
   3.06 E - 02, 2.91 E - 02, 2.79 E - 02, 2.70 E - 02, 2.65 E - 02, 
   2.62 E - 02, 2.62 E - 02, 2.66 E - 02, 2.73 E - 02, 2.83 E - 02, 
   2.94 E - 02, 3.10 E - 02, 3.28 E - 02, 3.49 E - 02, 3.72 E - 02, 
   3.97 E - 02, 4.23 E - 02, 4.50 E - 02, 4.80 E - 02, 5.11 E - 02, 
   5.40 E - 02};
d = Rest[Transpose[{xs, ys}]];

We can calculate a fit with the 3 lowest functions:

model = c0 + c1  Sin[w  x + d1 ] + c2  Sin[2 w  x + d2];
f[x_] = model /. FindFit[d, model, {c0, c1, c2, w, d1, d2}, x];

11.4938 - 8.17344  Sin[6.21729 - 1.9709 x] + 
 2.04074  Sin[2.08517 + 0.985452 x]

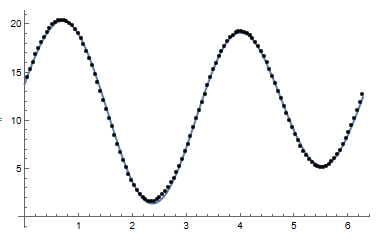
The result is:

enter image description here

$\endgroup$
3
  • $\begingroup$ note though that the y values were not imported correctly (they are in spreadsheet exponential notation). $\endgroup$ Commented Feb 29 at 17:47
  • $\begingroup$ @ Daniel Lichtblau You are right, nobody is perfect :). But the general method is nevertheless valid. $\endgroup$ Commented Feb 29 at 17:54
  • $\begingroup$ Yes, the method seems fine. Actually I get something similar just messing with Fourier. To get the actual values from yours, one can wrap quotes around it and do a replacement like so. ToExpression[StringReplace["..."," E "->"*10^"]]. $\endgroup$ Commented Feb 29 at 18:16
3
$\begingroup$

If you just want to "describe" the data with a function (as opposed to obtaining a function with theoretically meaningful and interpretable parameters), then the answer from @DanialHuber is what you want. Here is an example with 4 terms of the form a[i] Sin[w[i] ϕ + θ[i]].

θ = {0, 0.05236, 0.10472, 0.15708, 0.20944, 0.2618, 0.31416, 0.36652, 0.41888, 0.47124, 0.5236, 0.57596, 0.62832, 0.68068, 0.73304, 0.7854, 0.83776, 0.89012, 0.94248, 0.99484, 1.0472, 1.09956, 1.15192, 1.20428, 1.25664, 1.309, 1.36136, 1.41372, 1.46608, 1.51844, 1.5708, 1.62316, 1.67552, 1.72788, 1.78024, 1.8326, 1.88496, 1.93732, 1.98968, 2.04204, 2.0944, 2.14675, 2.19911, 2.25147, 2.30383, 2.35619, 2.40855, 2.46091, 2.51327, 2.56563, 2.61799, 2.67035, 2.72271, 2.77507, 2.82743, 2.87979, 2.93215, 2.98451, 3.03687, 3.08923, 3.14159, 3.19395, 3.24631, 3.29867, 3.35103, 3.40339, 3.45575, 3.50811, 3.56047, 3.61283, 3.66519, 3.71755, 3.76991, 3.82227, 3.87463, 3.92699, 3.97935, 4.03171, 4.08407, 4.13643, 4.18879, 4.24115, 4.29351, 4.34587, 4.39823, 4.45059, 4.50295, 4.55531, 4.60767, 4.66003, 4.71239, 4.76475, 4.81711, 4.86947, 4.92183, 4.97419, 5.02655, 5.07891, 5.13127, 5.18363, 5.23599, 5.28835, 5.34071, 5.39307, 5.44543, 5.49779, 5.55015, 5.60251, 5.65487, 5.70723, 5.75959, 5.81195, 5.86431, 5.91667, 5.96903, 6.02139, 6.07375, 6.12611, 6.17847, 6.23083, 6.28319};

r2w = {0.000376, 0.000526, 0.00052, 0.000503, 0.000527, 0.000541, 0.000502, 0.000551, 0.000541, 0.000542, 0.000539, 0.000547, 0.000545, 0.000544, 0.000559, 0.000545, 0.000544, 0.000555, 0.000558, 0.000539, 0.00054, 0.00056, 0.000529, 0.000532, 0.000524, 0.000509, 0.000499, 0.000442, 0.000474, 0.000467, 0.000465, 0.000409, 0.000355, 0.000341, 0.000297, 0.000269, 0.000266, 0.000245, 0.00022, 0.000229, 0.000263, 0.000246, 0.000247, 0.00018, 0.000249, 0.000254, 0.000253, 0.000277, 0.000297, 0.000302, 0.000295, 0.000294, 0.000336, 0.000378, 0.000415, 0.000431, 0.000445, 0.000443, 0.000471, 0.000448, 0.000454, 0.000449, 0.000426, 0.000433, 0.000454, 0.000447, 0.00043, 0.000437, 0.000446, 0.000456, 0.000429, 0.000438, 0.000433, 0.000422, 0.000407, 0.000422, 0.0004, 0.000404, 0.000439, 0.00043, 0.000415, 0.000432, 0.000427, 0.000426, 0.000472, 0.000436, 0.000418, 0.000406, 0.000453, 0.000389, 0.000369, 0.000364, 0.000324, 0.000274, 0.000262, 0.000251, 0.000235, 0.00022, 0.00025, 0.000221, 0.000229, 0.000266, 0.000264, 0.000255, 0.000252, 0.000268, 0.00028, 0.000306, 0.000377, 0.000357, 0.000348, 0.000411, 0.000421, 0.000407, 0.000427, 0.000474, 0.000446, 0.000484, 0.000502, 0.000537, 0.000519};

DataR2w = Transpose[{θ, r2w}];
k = 4;
model = a0 + Sum[a[i] Sin[w[i]  ϕ + θ[i]], {i, k}]
nlm = NonlinearModelFit[DataR2w, model,
   Join[{{a0, Mean[DataR2w[[All, 2]]]}}, Flatten[Table[{a[i], w[i], θ[i]}, {i, k}]]],
   ϕ, MaxIterations -> 10000];
Show[ListPlot[DataR2w], Plot[nlm[ϕ], {ϕ, 0, 2 π}, WorkingPrecision -> 20]]
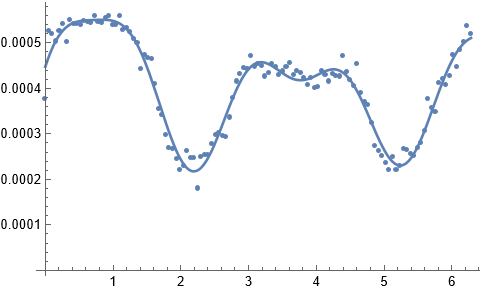
Data and fit with 4 sets of sine curves

If the proposed model is theoretically based and still desired to fit, then the fit is straightforward with NonlinearModelFit:

modelR2w = y1 + DL  Cos[ϕ + a2] + FL  (2  Cos[ϕ + a2]^3 - Cos[ϕ + a2]);
nlm = NonlinearModelFit[DataR2w, modelR2w, {y1, DL, a2, FL}, ϕ]
mpb = nlm["MeanPredictionBands"];
Show[ListPlot[DataR2w], 
 Plot[{nlm[ϕ], mpb}, {ϕ, 0, 2 π}, PlotStyle -> {Black, LightGray, LightGray}]]
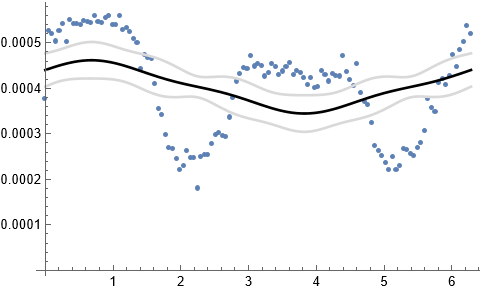
Data and fit with original model

This is not a good fit but not the fault of NonlinearModelFit. What appears to be missing is a parameter that @DanielHuber noticed and included. Rewriting the model with that missing parameter provides a much better fit but then doesn't show that the data likely resulted from such a model.

modelR2wx = y1 + DL  Cos[w  ϕ + a2] + FL  (2  Cos[w  ϕ + a2]^3 - Cos[w  ϕ + a2]);
nlmx = NonlinearModelFit[DataR2w, modelR2wx, {y1, DL, a2, FL, {w, 0.7}}, ϕ]
mpbx = nlmx["MeanPredictionBands"];
Show[ListPlot[DataR2w], 
 Plot[{nlmx[ϕ], mpbx}, {ϕ, 0, 2 π}, PlotStyle -> {Black, LightGray, LightGray}]]
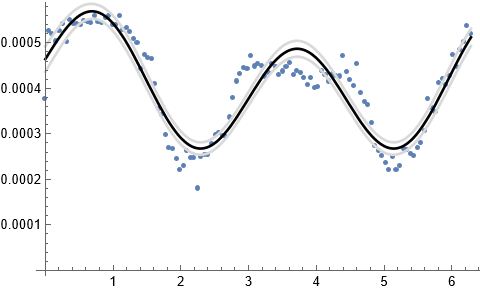
Data and modified parameter

$\endgroup$

Your Answer

By clicking “Post Your Answer”, you agree to our terms of service and acknowledge you have read our privacy policy.

Not the answer you're looking for? Browse other questions tagged or ask your own question.