6
$\begingroup$

I recently asked how to

colour the "leaves" (self-intersections) of parametric curves

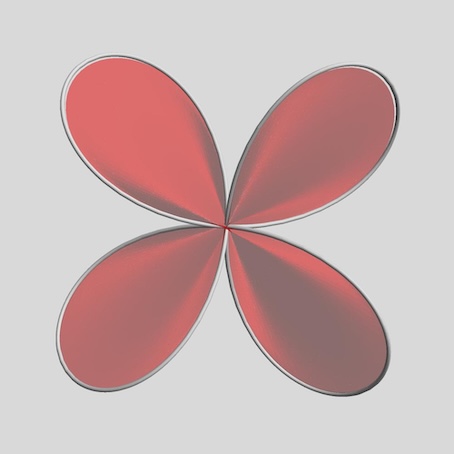
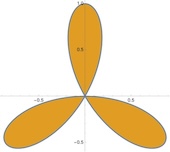
and got two great answers from cvgmt and kglr, allowing us to produce images of 2D parametric curves like this one:

enter image description here

I want to find a similar filling method for 3D space curves. Here are three of them:

crown = {Cos[0.3 #], Sin[0.3 #], 0.75 Sin[0.7 #]} &;

noeud = {2  Cos[#] - 2 Cos[3 #], 2  Sin[#] + 2 Sin[3 #], Sin[4 #]} &;

viviani = {Cos[#], Sin[#], 2 Sin[#/2]} &;

It follows my only partly successful attempt to fill 3D "leaves"

SpaceFilling[
  curve_,
  r_,   (* plot range *)
  p_,   (* polygon resolution *)
  op_,  (* opacity *)
  tr_,  (* tube radius *)
  st_,  (* polygon steps *)
  sm_   (* polygon smoothing *) ] :=
 
 Show[

  Graphics3D[{Opacity[op], EdgeForm[], FaceForm[Darker @ Red], 
    Map[Polygon[Flatten[MapAt[Reverse, #1, {2}], 1]] &, 
     Partition[
      Module[{dt = 
         Table[#1[[1]] + 1/st n (#1[[2]] - #1[[1]]), {n, 1, st}] & /@ 
          Transpose[{Table[curve[t], {t, 0., r, r /p}], 
            Table[curve[t], {t, r, 2. r, r/p}]}]},
       Do[
        dt = 
         Table[If[x =!= 1 && x =!= Length[dt] && y =!= 1 && y =!= st, 
           Mean[{dt[[x - 1, y]], dt[[x + 1, y]], dt[[x, y - 1]], 
             dt[[x, y + 1]]}], dt[[x, y]]], {x, 1, Length[dt]}, {y , 
           1, st}],
        {sm}];

       dt],
      {2, 2}, {1, 1}],
     {2}]}],
  
  ParametricPlot3D[curve[t], {t, 0, 2 r},
    PlotStyle -> Directive[Lighter @ Gray],
    Axes -> False,
    Boxed -> False,
    BoxRatios -> 1,
    PlotPoints -> 128] /. Line -> (Tube[#, tr] &),
  
  Background -> GrayLevel[0.85],
  Boxed -> False,
  ImageSize -> 400,
  Lighting -> "Neutral",
  SphericalRegion -> True]

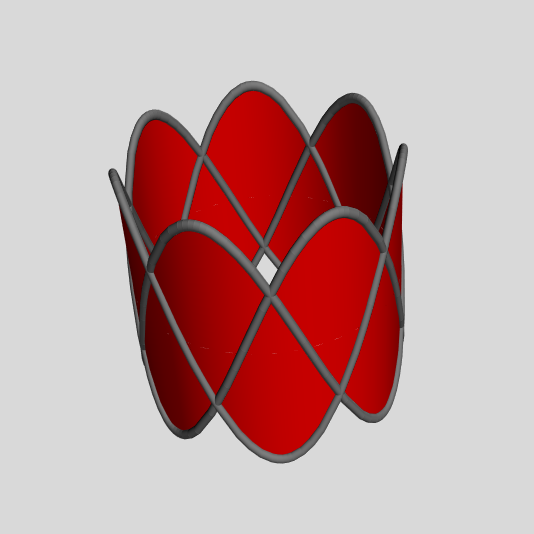
Applying SpaceFilling to a noeud curve looks promising, but as you rotate it, ugly polygon intersections emerge.

enter image description here

The contours of a crown curve are replicated nicely, but the polygons extend into the interior.

SpaceFilling[crown, 10 Pi, 100, 0.5, 0.02, 100, 100]

enter image description here

And the filling of the seemingly simple viviani curve is completely wrong.

SpaceFilling[viviani, 2 Pi, 100, 0.5, 0.04, 100, 10]

enter image description here

My request

I probably got stuck in a dead-end street, and we need a completely different approach (using region functions like in the 2D case). If this is impossible or too difficult, I would also accept an answer that significantly improves SpaceFilling, especially the polygon creation and smoothing method.

$\endgroup$
3
  • 1
    $\begingroup$ wrap ParametricPlot3D[viviani[t], {t, 0, 4 Pi}, PlotStyle -> Black, Axes -> False, Boxed -> False, BoxRatios -> 1, PlotPoints -> 128] with ReplaceAll[ l_Line :> {Opacity[.5], EdgeForm[], FaceForm[Darker@Red], Polygon @@ l, LightGray, Tube[#, .05] & @@ l}]? (similarly with noeud and crown) $\endgroup$
    – kglr
    Commented Jan 21 at 14:46
  • 1
    $\begingroup$ It functions perfectly for noeud and viviani, but not for crown. However, this is such an amazing improvement, that I would accept it as an answer. $\endgroup$
    – eldo
    Commented Jan 21 at 15:32
  • $\begingroup$ Thanks for editing @ user444 $\endgroup$
    – eldo
    Commented Jan 21 at 23:48

1 Answer 1

6
$\begingroup$

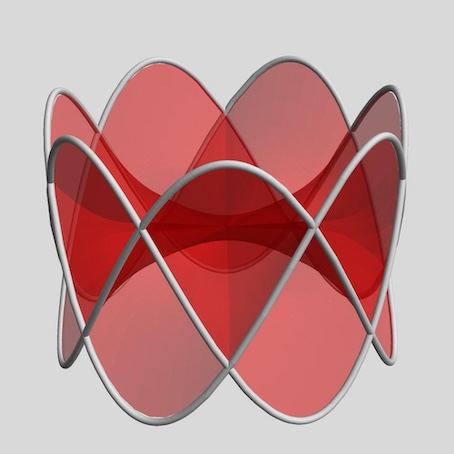
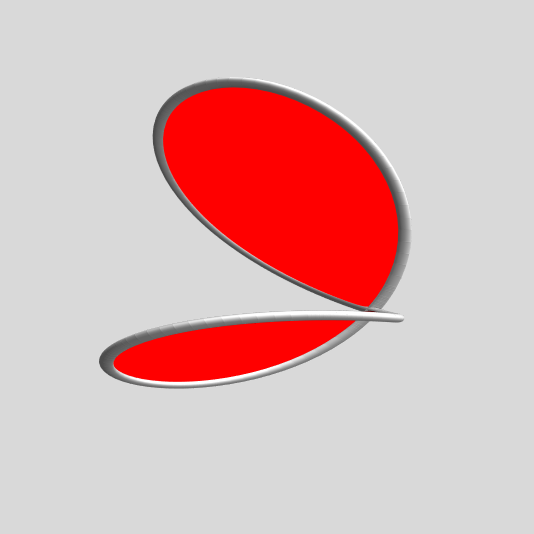
For crown we can use the three-argument form of ParametricPlot3D to get the desired surface:

ParametricPlot3D[{1, 1, v} crown[t], 
  {t, 0, FunctionPeriod[Rationalize @ crown[t], t]}, {v, 0, 1}, 
  PlotStyle -> Directive[EdgeForm[], Red], SphericalRegion -> True, 
  Axes -> False, Boxed -> False, BoxRatios -> 1, PlotPoints -> 128, 
  Background -> GrayLevel[0.85], Boxed -> False, ImageSize -> 400, 
  Lighting -> "ThreePoint",   MeshFunctions -> {#5 &}, Mesh -> {{1}}, 
  MeshStyle -> Gray, Method -> {"BoundaryOffset" -> False}] /. 
 Line[x_] :> Tube[x, .03]

enter image description here

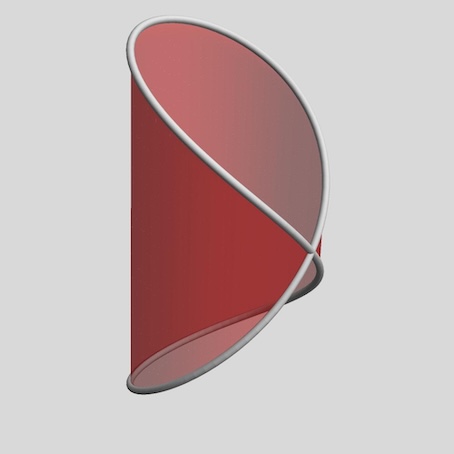
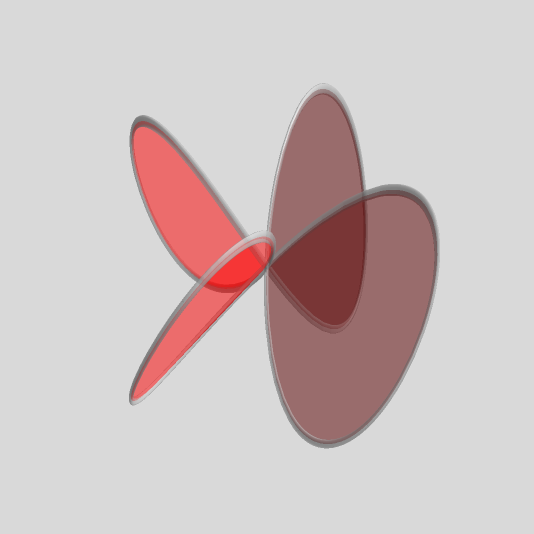
For viviani and noeud we can post-process to replace Line objects with Polygon and Tube objects:

lineToPolygonAndTube = ReplaceAll[l_Line :> 
     {Opacity[1], EdgeForm[],  FaceForm[Red, Red],
      Polygon @@ l, LightGray, Tube[#, .05] & @@ l}];

lineToPolygonAndTube@
 ParametricPlot3D[viviani[t],
  {t, 0, FunctionPeriod[Rationalize @ viviani[t], t]}, 
  PlotStyle -> Black, 
  Axes -> False, Boxed -> False, BoxRatios -> 1, PlotPoints -> 128, 
  SphericalRegion -> True, Background -> GrayLevel[0.85], 
  ImageSize -> 400, Lighting -> "Neutral"]

enter image description here

Replace viviani with noeud and Opacity[1] with Opacity[.5] to get

enter image description here

$\endgroup$
2
  • $\begingroup$ Thank you, kglr, for these marvelous solutions. Now there are only two space curves left in my portfolio which cause problems. If you know a solution for them, please post it as a second answer. First curve: {Cos[4 #] Cos[#], Cos[4 #] Sin[#], 0.6 Cos[4 #]} & with a period of 2 Pi $\endgroup$
    – eldo
    Commented Jan 22 at 8:52
  • $\begingroup$ Second curve (Period 20 Pi): {Cos[#]*(0.5 - Cos[Pi/3]) + Cos[#]*Cos[Pi/3]*Cos[0.9 #] + Sin[#]*Sin[0.9 #], Sin[#]*(0.5 - Cos[Pi/3]) + Sin[#]*Cos[Pi/3]*Cos[0.9 #] - Cos[#]*Sin[0.9 #], -Sin[Pi/3] + -Sin[Pi/3]*Cos[0.9 #] } & $\endgroup$
    – eldo
    Commented Jan 22 at 8:55

Your Answer

By clicking “Post Your Answer”, you agree to our terms of service and acknowledge you have read our privacy policy.

Not the answer you're looking for? Browse other questions tagged or ask your own question.