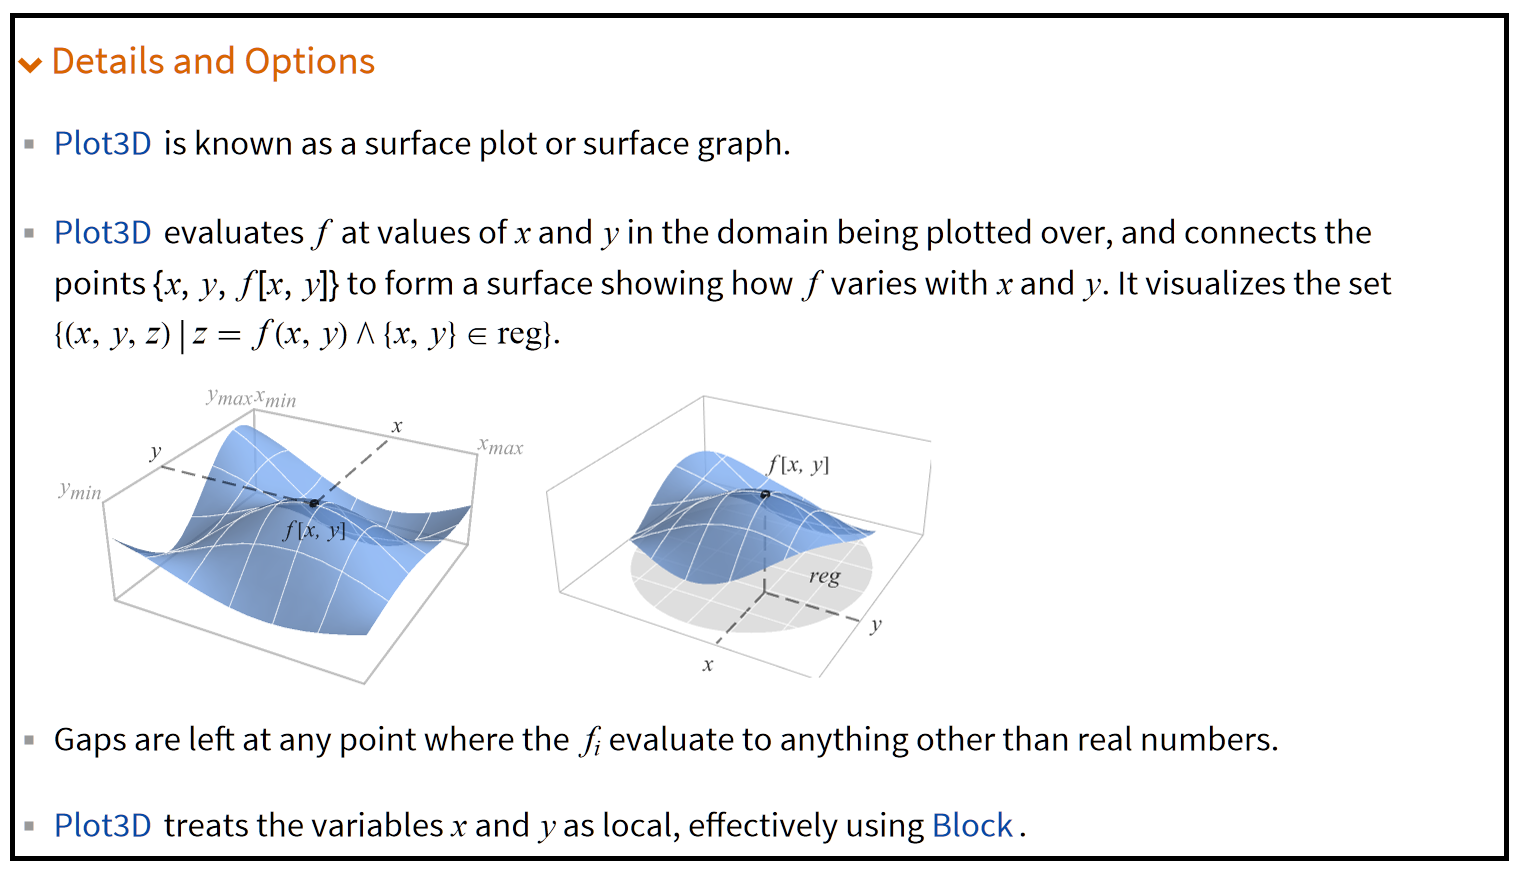
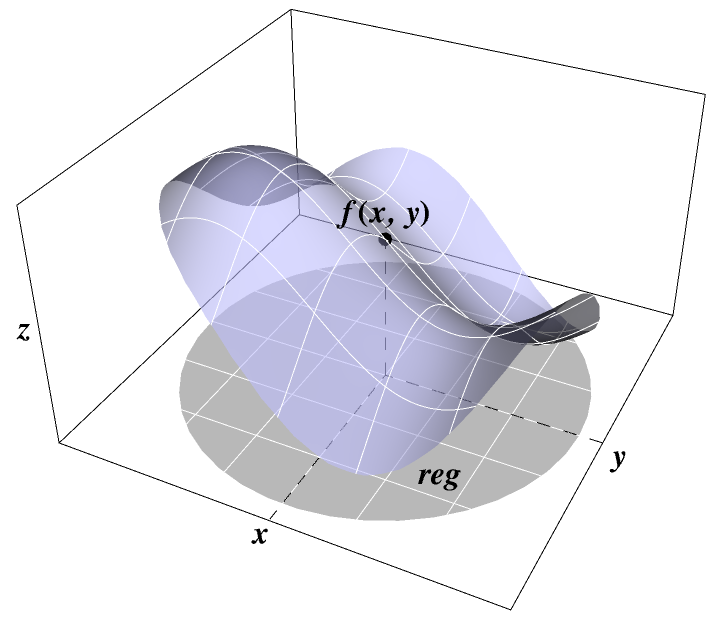
I find the two graphs (see below) in Plot3D's help page elegant and appealing. How can I reproduce it? I read the whole help page but didn't find how the graphs were made.
1 Answer
When all else fails you can construct graphics explicitly using Show, Graphics3D and Plot3D:
Show[
 Graphics3D[
  {Line[
    {{{-3.5, -3.5, -2}, {-3.5, 3.5, -2}, {3.5,
       3.5, -2}, {3.5, -3.5, -2}, {-3.5, -3.5, -2},
      {-3.5, -3.5, 2}, {-3.5, 3.5, 2}, {3.5, 3.5, 2}, {3.5,
       3.5, -2}},
     {{-3.5, 3.5, 2}, {-3.5, 3.5, -2}}}],
   Dashing[1/50],
   Line[{{0, 0, -2}, {0, 0, -Sin[-1/2]}}],
   PointSize[Large],
   Point[{0, 0, -Sin[-1/2]}],
   Line[{{3.5, 0, -2}, {0, 0, -2}, {0, -3.5, -2}}],
   Text[f[x, y], {0, 0, -Sin[-1/2]}, {0, -1.5}],
   Text[x, {0, -3.5, -2}, {1, 1}],
   Text[y, {3.5, 0, -2}, {-2, 1}],
   Text[z, {-3.5, -3.5, 0}, {2, 0}],
   Text[reg, {1.7, -1.7, -2}]},
  BaseStyle -> {16, Bold, Italic, FontFamily -> "Times"},
  Boxed -> False, ViewPoint -> {1, -2, 1.5}],
 Plot3D[{-Sin[x] - Sin[y - 1/2], -2.001},
  {x, y} \[Element] Disk[{0, 0}, Pi],
  PlotStyle -> {RGBColor[{0.75, 0.75, 1, 0.6}], White},
  BoundaryStyle -> None,
  Lighting -> "Accent",
  Mesh -> 5, PlotPoints -> 50, MeshStyle -> White]]
Here Graphics3D constructs the sides of the box we want, dashed lines, the point on the surface, and places text (styled with BaseStyle) at relevant offset directions from specific points.
Plot3D takes care of the actual surface, the plotting region (including the "shadow" under it) and their styling and lighting. If you don't want a partially drawn box or other extra annotations you can just use Plot3D part and remove the rest.


Plot3Dpage. What exactly are you having difficulty with? The color scheme, mesh lines, labeling? Please be more specific. Thanks. $\endgroup$p. Now domyopts = AbsoluteOptions[p]which gives you all options used to generate the plot. But without knowing the function used it is hard to make progress. Here is screen shot !Mathematica graphics you can now use same options in your Plot3D command. $\endgroup$Boxedcan be used to draw specific faces of the box... which is an undocumented feature. $\endgroup$