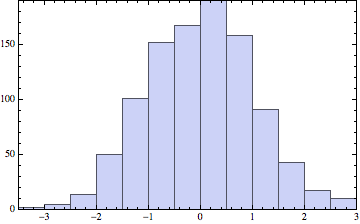
An example:
Histogram[RandomVariate[NormalDistribution[], 1000],
 PlotRangePadding -> 0,
 Frame -> True,
 FrameTicks -> {{{0, 0}}, {}}]
I expected this to produce a histogram without ticks. However:

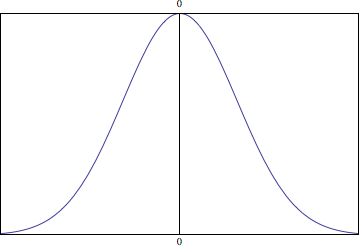
Meanwhile, if I use the same tick specification with Plot:
Plot[PDF[NormalDistribution[], x], {x, -\[Pi], \[Pi]},
 PlotRangePadding -> 0,
 Frame -> True,
 FrameTicks -> {{{0, 0}}, {}}]


FrameTicks->Nonewhat you want? $\endgroup$FrameTickswhenHistogramwasn't yet present. So, it only got the newer form. According to the docs,FrameTicksaccepts specifications of the form{{left, right}, {bottom, top}}, so you're looking forFrameTicks -> {{{},{}}, {{},{}}}. $\endgroup$Histogramshows this row, whereframeticksis the option value:If[! MatchQ[frameticks, {{_, _}, {_, _}}], frameticks = ({{#1, #1}, {#1, #1}} &)[frameticks]];And since original specification doesn't match it gets turned into some ungodly{{{{}, {}}, {{}, {}}}, {{{}, {}}, {{}, {}}}}which gets thrown out later and replaced with Automatic ticks because it is not Visualization`Utilities`FrameTicksQ $\endgroup$