1
$\begingroup$

chi(t) is implicit function. The implicit function can be plotted by ContourPlot.

Is it possible to obtain chi(t) explicitly using function interpolation?
chi=Interpolation[...], t∈(0, 300)

ClearAll["Global`*"]

eq[chi_, t_] := 
  0.7*(t - 315)*(chi)^(1/1.6) + 
   0.008*(chi)^(1/1.6 + 1/0.4)*1000^(1/0.4) - 1;


ContourPlot[eq[chi, t] == 0, {t, 0, 300}, {chi, 0, 100*10^(-3)}]
$\endgroup$

2 Answers 2

3
$\begingroup$
Clear[chi, eq, t]

eq[chi_, t_] := 
  7/10*(t - 315)*(chi)^(10/16) + 8/1000*(chi)^(10/16 + 10/4)*1000^(10/4) - 1;

Solve for chi directly,

chi[t_] = Piecewise[List @@@ SolveValues[eq[c, t] == 0, c, Reals]];

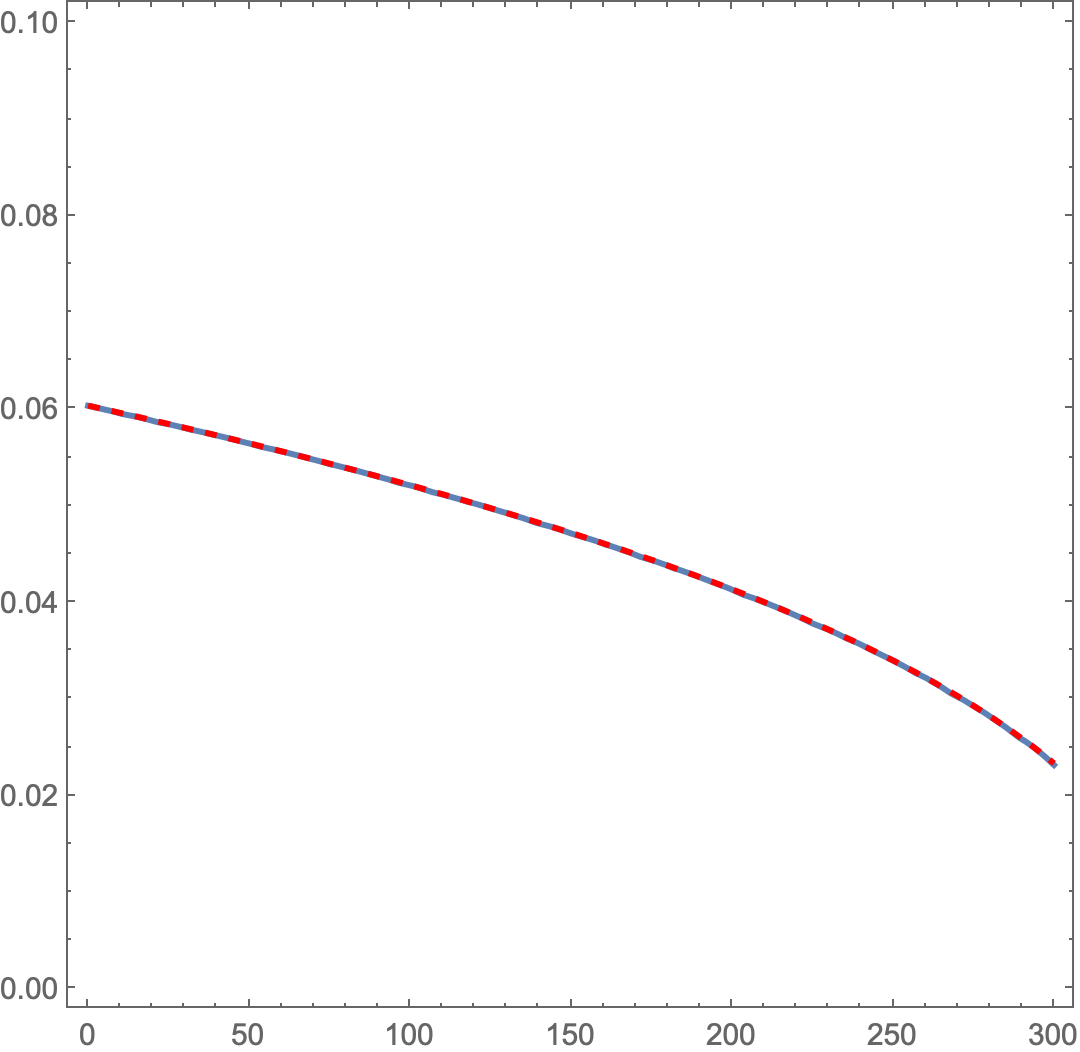
Comparing the two plots

Show[
 ContourPlot[eq[chi, t] == 0, {t, 0, 300}, {chi, 0, 100*^-3}],
 Plot[chi[t], {t, 0, 300}, PlotStyle -> {{Red, Dashed}}]]

enter image description here

$\endgroup$
3
$\begingroup$

You can extract the points from the plot and interpolate them:

q[chi_, t_] = 0.7*(t - 315)*(chi)^(1/1.6) + 0.008*(chi)^(1/1.6 + 1/0.4)*1000^(1/0.4) - 1;
plt = ContourPlot[eq[chi, t] == 0, {t, 0, 300}, {chi, 0, 100*10^(-3)}];
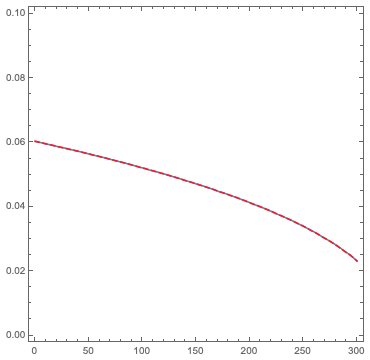
pts = First@Cases[Normal@plt, Line[a_] :> a, Infinity];
f = Interpolation[pts, InterpolationOrder -> 1];
Show[plt, Plot[f[x], {x, 0, 300}, PlotStyle -> {{Red, Dashed}}]]

enter image description here

$\endgroup$

Your Answer

By clicking “Post Your Answer”, you agree to our terms of service and acknowledge you have read our privacy policy.

Not the answer you're looking for? Browse other questions tagged or ask your own question.