4
$\begingroup$

Consider the minimal example

RegionPlot[{x^2 < y^3 + 1, y^2 < x^3 + 1}, {x, -2, 5}, {y, -2, 5}]

Then I can use

PlotStyle -> {Red, Yellow}
BoundaryStyle -> {1 -> Green, 2 -> Blue}

to, for example, set the red and yellow the first and second region, respectively. And also turn the boundaries green and blue in the same order.

The problem arises when I try to promote this change to a theme

Themes`AddThemeRules["test",
  PlotStyle -> {Red, Yellow},
  BoundaryStyle -> {1 -> Green, 2 -> Blue}
  ];

Now applying this theme PlotTheme->"test" doesn't seem to work but in particular it turns all the boundaries black and thin.

Any thoughts on how to make this work? I prefer working with themes or something similar to keep my code cleaner.

$\endgroup$

1 Answer 1

2
$\begingroup$
System`PlotThemeDump`resolvePlotTheme["Default", "RegionPlot"]

enter image description here

You can customize the default theme of RegionPlot by changing the above output and name it as new theme "test" by the following code.

System`PlotThemeDump`resolvePlotTheme["test", p : "RegionPlot"] := 
 System`PlotThemeDump`resolvePlotTheme["Default", 
   "RegionPlot"] /. {("DefaultBoundaryColor" -> _) -> 
    "DefaultBoundaryColor" -> {1 -> Green, 
      2 -> Blue}, ("DefaultColor" -> _) -> 
    "DefaultColor" -> {1 -> Red, 2 -> Yellow}}

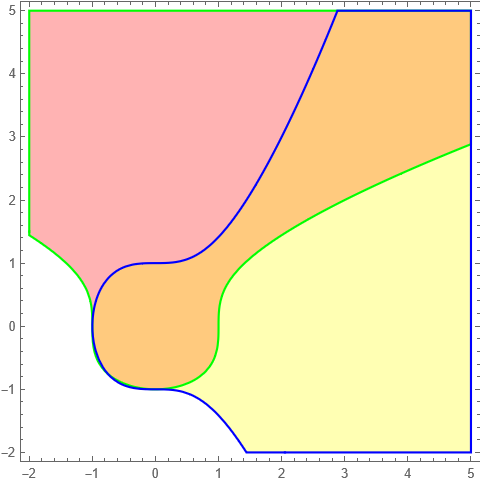
RegionPlot[{x^2 < y^3 + 1, y^2 < x^3 + 1}, {x, -2, 5}, {y, -2, 5}, 
 PlotTheme -> "test"]

enter image description here

$\endgroup$

Your Answer

By clicking “Post Your Answer”, you agree to our terms of service and acknowledge you have read our privacy policy.

Not the answer you're looking for? Browse other questions tagged or ask your own question.