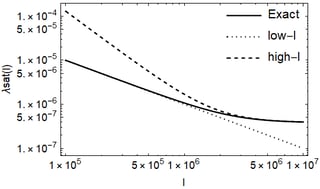
I have the following Mathematica code:
$Assumptions = {r \[Element] Reals, r >= 0, rh \[Element] Reals,
   rh > 0, qe \[Element] Reals, qe >= 0, qm \[Element] Reals, qm >= 0,
    z \[Element] Reals, z >= 0, zh \[Element] Reals, zh >= 0};

S[rh_] := \[Pi] rh^2

M[rh_, qe_, qm_] :=
 1/2 Sqrt[\[Pi]/S[rh]] (S[rh]^2/\[Pi]^2 + S[rh]/\[Pi]  + qe^2 + qm^2)

qe = (r* rh* \[Phi]e)/(r - rh);

f[r_, rh_, qm_, \[Phi]e_] :=
 1 + r^2/l^2 - (2 M[rh, qe, qm])/r + (qe^2 + qm^2)/r^2

Veff[r_] = f[r, rh, qm, \[Phi]e]*(L^2/r^2);

r0 = Solve[Simplify[Veff'[r] == 0], r, Reals][[2]];

\[Lambda][rh_, qm_, \[Phi]e_, l_] =
  1/Sqrt[2] Sqrt[-((r^2 f[r, rh, qm, \[Phi]e])/L^2) Veff''[r]] /. r0 //
    Simplify;
When I try to plot $\lambda$ v/s $r_h$ for specific values of $q_m$ and $\phi_e$, I find that $\lambda$ saturates to the value $\frac{1}{l}$ when I try using different values of $l$ say 1,2,3 etc. To make it concrete, I also try to find the relation of $\lambda$ v/s $l$ graphically by using the following line of code:
\[Lambda]sat[q_, \[Phi]_, l_] = \[Lambda][100, q, \[Phi], l];

Plot[{\[Lambda]sat[1, 1, l], l^-1}, {l, 0, 100}]
As you can visually check that the relation holds from the plot. My only desire is to prove this analytically. I tried using limits and series method on Mathematica but in vain. How to use Mathematica to prove the relation $\lambda_{sat}=1/l$ analytically ?


Limit? I leave it to someone else to show how, for some easy rep. $\endgroup$Limit$rh \rightarrow \infty$ . $\endgroup$