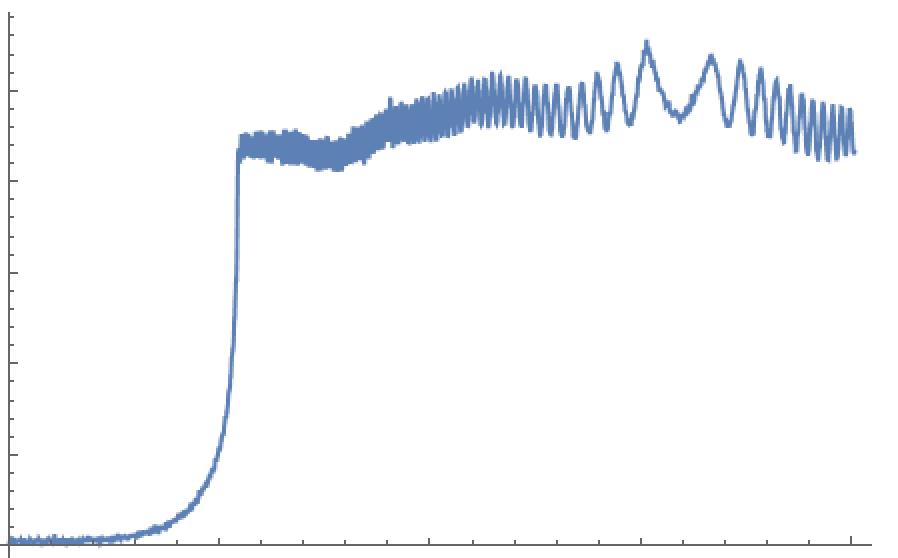
I have an x-y data list. The data is here. It looks like below:

I want to mark the knee location. I mean I need to find the point of greatest slope change and get the x coordinate of this point. Theoretically, this position is around x=29.2519.
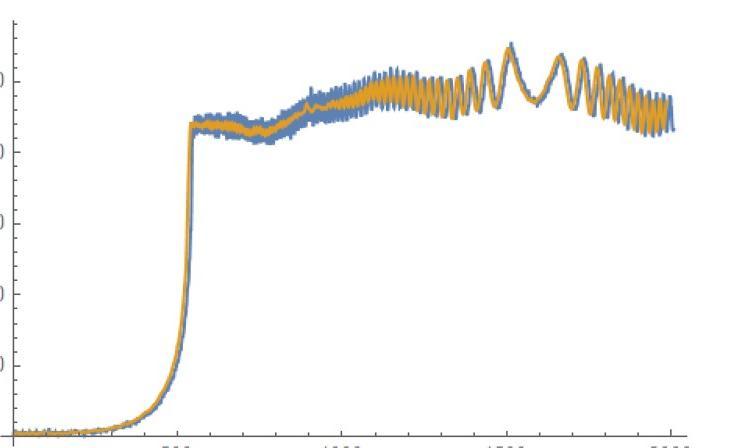
I tried SavitzkyGolayMatrix method and get the below result (x=29.4461). This result is a little deviation from the theoretical result x=29.2519.

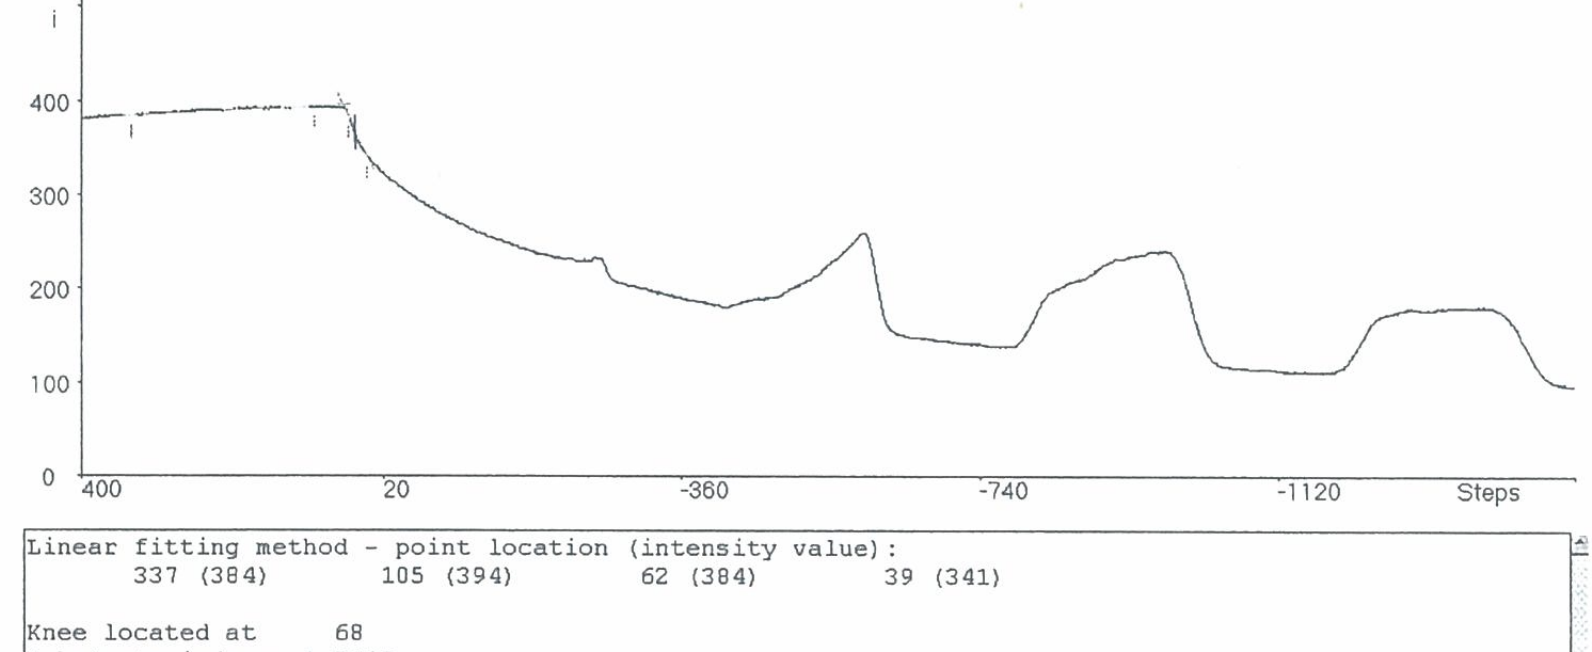
I read some literature. Find them with a method: a least squares fit method, find the knee by intersecting two straight lines. And they show the below similar pictures:

Can someone tell me how to implement this method? Thank you!
