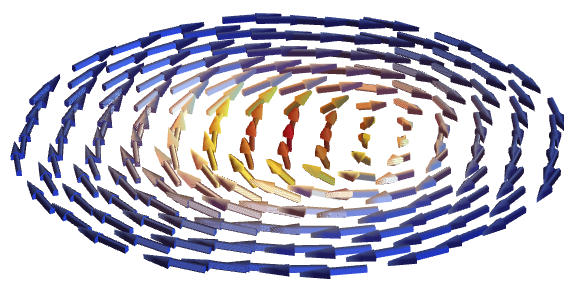
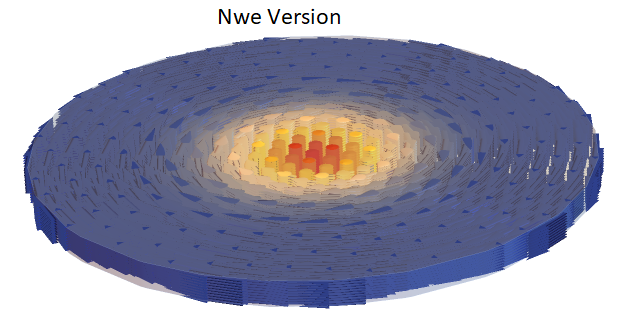
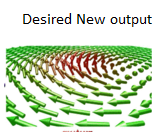
Hi Used to use the old version of Mathematica back in 2020. Now the new version is updated and I am trying to run the old code in the new version. My vector plots are very different. I wonder what I should do to get a better image. Here is the code. The image attached is based on the old version. In the recent version, the image is very different. I want to have a vector 3d plot the image shown as desired new output.
{X = 1; Y = 1;
R = 2 X/8;
fmZ = 0.2;
\[Theta][x_, y_] := \[Pi]/2 -
   2 ArcTan[Exp[-((x^2 + y^2)/R^2)]]; (*Polar angle*)
t = 1; (*Skyrmion of the first kind \[Rule] t=0; Skyrmion of the \
second kind \[Rule] t=1 *)


(*cos and sin of azimuthal angle*)
\[Phi][x_, y_ ] := ArcTan[x, y] - Pi/2; "Dn";

g6 = VectorPlot3D[{Cos[\[Phi][x, y ]] Sin[\[Theta][x, y]],
    Sin[\[Phi][x, y ]] Sin[\[Theta][x, y]],
    Cos[\[Theta][x, y]]}, {x, -X, X}, {y, - Y, Y}, {z, fmZ/2,
    fmZ/2 + 0.01}, VectorScale -> 0.05, VectorPoints -> 25,
   VectorStyle -> {Blue, "Arrow3D"},
   VectorColorFunction ->
    Function[{x, y, z, vx, vy, vz, n},
     ColorData["TemperatureMap"][
      Exp[-40 ((x - 0.5)^2 + (y - .5)^2)]]], Boxed -> False,
   Axes -> False, BoxRatios -> {1, 1, 0.03},
   RegionFunction -> Function[{x, y, z}, x^2 + y^2 < 0.4],
   PlotLabel ->
    Style[Framed[Subscript[D, n]], 16, Blue, Bold,
     Background -> Lighter[Yellow]]];
Show[g6]}


fmZisn't defined! $\endgroup$