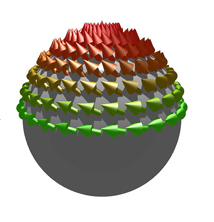
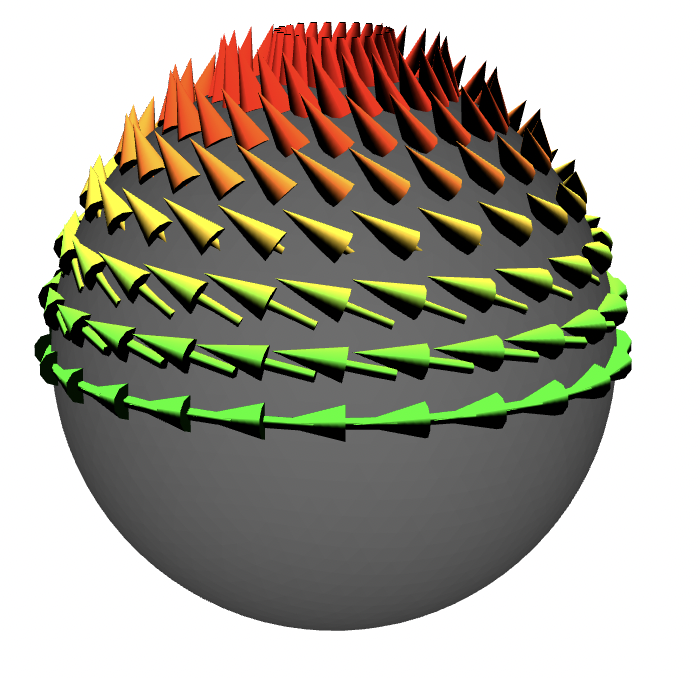
How I can plot the flowing image using Mathematica?
1 Answer
$\begingroup$
$\endgroup$
3
The lighting is a bit hard to get right without ray-tracing (though possible in Mathematica on Mac). Here is a first attempt, feel free to improve.
vpts = Catenate@
   Table[FromSphericalCoordinates[{1.0, \[Theta], \[Phi]}], {\[Theta],
      Range[0, Pi/2, Pi/16] // Rest}, {\[Phi],
     Most[Range[-Pi, Pi, Pi/12]] + 0.001}];
SliceVectorPlot3D[{y, -x, z}, "CenterSphere", {x, -1, 1}, {y, -1,
  1}, {z, -1, 1}, VectorPoints -> vpts,
 VectorColorFunction -> (Blend[{Green, Red}, #3] &),
 VectorColorFunctionScaling -> False, VectorScaling -> None,
 VectorSizes -> 1.5,
 PlotStyle -> Directive[{Opacity[1], GrayLevel[0.3]}],
 Lighting -> (DirectionalLight[White, {Append[#, 15], {0, 0, 0}}] & /@
     CirclePoints[3]), Boxed -> False, Axes -> False,
 ViewVector -> {{0, -10, 2.5}, {0.`, 0.`, 0.`}},
 ViewVertical -> {0, 0, 1}]
-
1$\begingroup$ Thank you, What about instead of curling the vector are perpendicular to the plan of the sphere, I mean not tangent just perpendicular in the upper half like hedgehog, $\endgroup$ Commented Aug 23, 2023 at 23:32
-
1$\begingroup$ you replace {y, -x, z} with {x, y, z} $\endgroup$– SHuismanCommented Aug 24, 2023 at 8:26
-
$\begingroup$ Thanks, it works, What about the 2d projection of the above image? Like 2d vectors in the plane and no sphere? $\endgroup$ Commented Aug 24, 2023 at 19:58


