directives = {Directive[Thick, RGBColor[0.40, 0.40, 0.80]],
   Directive[Thickness@Medium, Gray, Dashed],
   Directive[Thickness@Medium, Gray, Dashed]};
If you do not want to make any changes to fun:
1. Epilog + Show
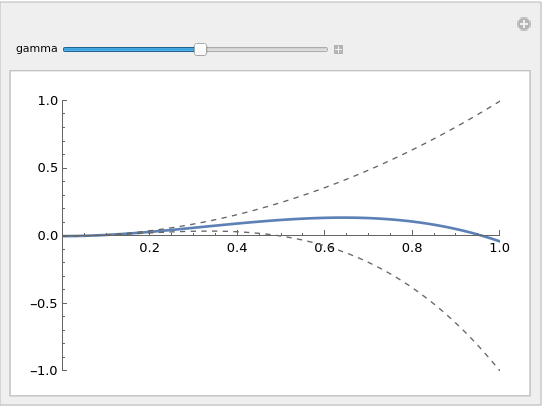
Extract the line primitives from fun[0] and fun[2] and used them Epilog with desired styles:
Manipulate[
 Show[fun[gamma],
  Epilog ->
    Thread[{Rest@directives, Cases[#, _Line, All] & /@ {fun[0], fun[2]}}],
  PlotRange -> {{0, 1}, {-1, 1}}, PlotRangePadding -> None],
 {{gamma, 0.5, "gamma"}, 0, 2, 0.01}]
2. Post-processing
ClearAll[replaceStyles]
replaceStyles[dirs_] := Module[{d = dirs},
  ReplaceAll[{_Directive, l_Line} :> {Last[d = RotateLeft[d]], l}]]
You can use replaceStyles in two ways:
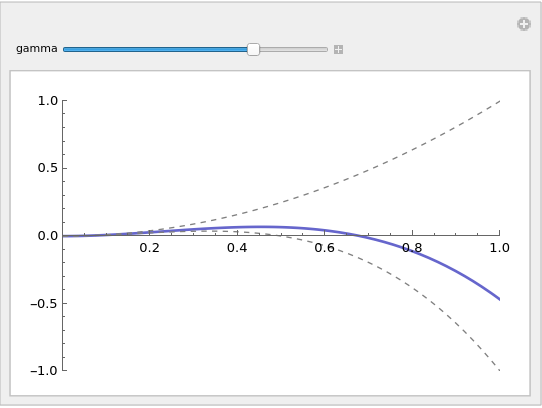
i. Wrap Show with replaceStyles[directives]:
Manipulate[replaceStyles[directives]@
  Show[{fun[gamma], fun[0], fun[2]},
    PlotRange -> {{0, 1}, {-1, 1}}, PlotRangePadding -> None],
 {{gamma, 0.5, "gamma"}, 0, 2, 0.01}]
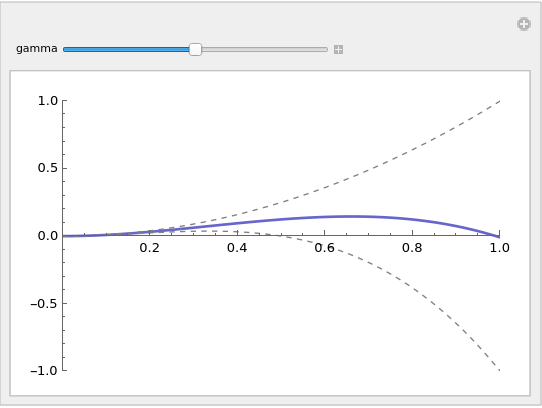
ii. Wrap {fun[...],..} in first argument of Show with replaceStyles[directives]:
Manipulate[
  Show[replaceStyles[directives] @ {fun[gamma], fun[0], fun[2]},
    PlotRange -> {{0, 1}, {-1, 1}}, PlotRangePadding -> None],
 {{gamma, 0.5, "gamma"}, 0, 2, 0.01}]
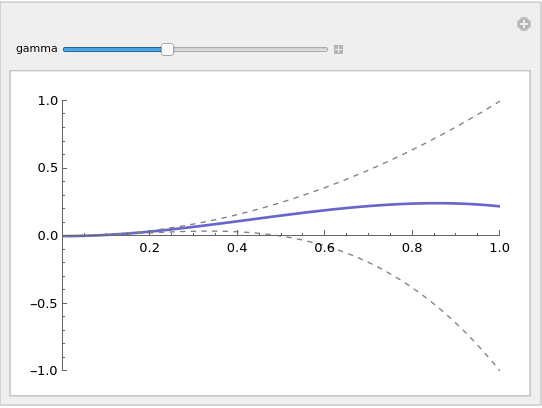
iii. Use it as option setting for DisplayFunction in Show[...]:
Manipulate[Show[{fun[gamma], fun[0], fun[2]},
  DisplayFunction -> replaceStyles[directives],
  PlotRange -> {{0, 1}, {-1, 1}}, PlotRangePadding -> None],
 {{gamma, 0.5, "gamma"}, 0, 2, 0.01}]
3. An alternative post-processing
ClearAll[injectDirectives]
injectDirectives[d_] := MapThread[ReplaceAll[l_Line :> {#, l}]@#2 &]@{d, #} &

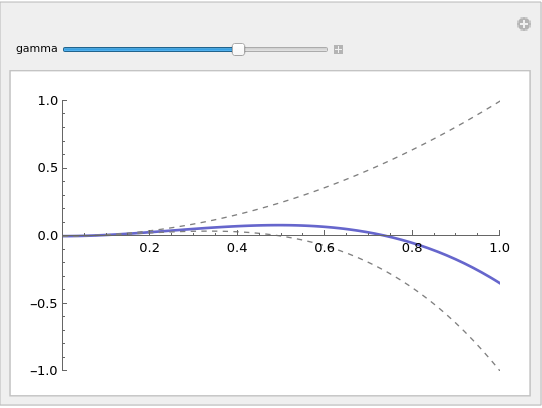
Manipulate[Show[
  injectDirectives[directives]@{fun[gamma], fun[0], fun[2]},
  PlotRange -> {{0, 1}, {-1, 1}}, PlotRangePadding -> None],
 {{gamma, 0.5, "gamma"}, 0, 2, 0.01}]
4. A more flexible fun
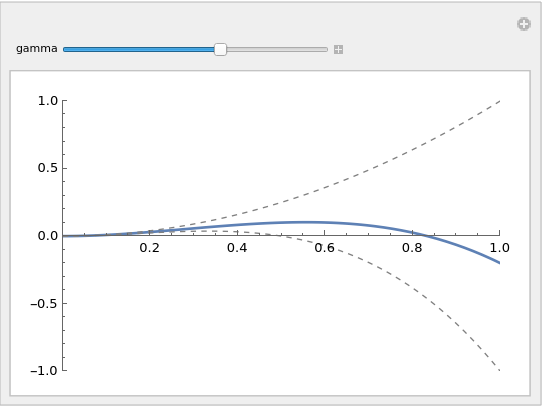
Alternatively, you can modify fun to take options:
ClearAll[morefun]

morefun[gamma_, o : OptionsPattern[]] := Plot[x^2 - gamma x^3, {x, 0, 1},
 o, PlotStyle -> Directive[Thickness@Medium, Gray, Dashed]]

Manipulate[Show[
  {morefun[gamma, PlotStyle -> Automatic], morefun[0], morefun[2]},
  PlotRange -> {{0, 1}, {-1, 1}},
  PlotRangePadding -> None],
 {{gamma, 0.5, "gamma"}, 0, 2, 0.01}]
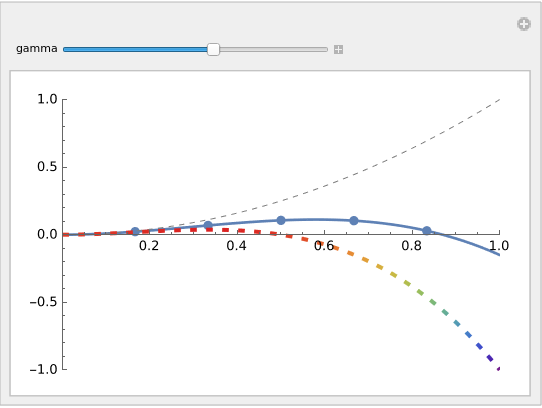
If you like you can add additional options:
Manipulate[
 Show[{morefun[gamma, PlotStyle -> Automatic, Mesh -> 5,
    MeshStyle -> PointSize @ Large],
   morefun[0],
   morefun[2, PlotStyle -> {Dashing[Medium], AbsoluteThickness[3]},
      ColorFunction -> "Rainbow"]},
  PlotRange -> {{0, 1}, {-1, 1}},
  PlotRangePadding -> None],
{{gamma, 0.5, "gamma"}, 0, 2, 0.01}]


Clear[fun]; fun[gamma_] := x^2 - gamma x^3; Manipulate[ Plot[{fun[gamma], fun[0], fun[2]}, {x, 0, 1}, PlotRange -> {{0, 1}, {-1, 1}}, PlotStyle -> {{Thick, RGBColor[0.40, 0.40, 0.80]}, {Medium, RGBColor[0.40, 0.40, 0.40], Dashed}}, PlotRangePadding -> None], {{gamma, 0.5, "gamma"}, 0, 2, 0.01}]$\endgroup$Plotfor my full code to work... $\endgroup$funfunction (last part in my question)? $\endgroup$PlotStylewe only need onePlot. $\endgroup$