1
$\begingroup$

The following code

ParametricPlot3D[{{Cos[t], Sin[t], t/2}, {Cos[t + Pi], Sin[t + Pi], t/2}, If[
   EvenQ[Floor[4 t/Pi]], {Cos[t], Sin[t], t/2}, {Cos[t + Pi], 
    Sin[t + Pi], t/2}]}, {t, 0, 4 Pi}, PlotStyle -> Black, 
 Boxed -> False, 
 ViewPoint -> {Infinity, 0, 0}, ViewVertical -> {0, -1, 0}, 
 Axes -> False]

yields

enter image description here

I want to export this as a vectorized image. However, when I save it as either PDF or SVG, I get some antialiasing artifacts. For example, zooming in,

enter image description here

Is there anyway to solve this?

$\endgroup$
8
  • $\begingroup$ what do you mean by when I save it as either PDF or SVG? Did you use the Export command? Please show all code used, not word description. $\endgroup$
    – Nasser
    Commented May 31, 2023 at 16:48
  • $\begingroup$ I mean exactly that, by right-clicking on the image and saving the graphic as a PDF. Running Export["img.pdf", img], where img is the object in the code, yields the same result. $\endgroup$
    – sam wolfe
    Commented May 31, 2023 at 16:50
  • $\begingroup$ See some related issue on this. For example exporting-graphics-for-publications-how-to-achieve-consistent-line-thicknesses I see same thing on windows 10 after exporting to pdf. $\endgroup$
    – Nasser
    Commented May 31, 2023 at 16:54
  • $\begingroup$ I am wondering if this is related to the 3D environment, and if I should somehow project the object onto a 2D plane before exporting it. For example, doing Export["img.pdf", Plot[Sin[x], {x, 0, 2 Pi}]] causes no issue, as expected. See this question $\endgroup$
    – sam wolfe
    Commented May 31, 2023 at 16:56
  • 1
    $\begingroup$ I think the following Q&A shows how to get the projection matrix: mathematica.stackexchange.com/questions/3528/…, if it's any help. $\endgroup$
    – Michael E2
    Commented May 31, 2023 at 18:44

2 Answers 2

3
$\begingroup$
  • replace ViewPoint -> {Infinity, 0, 0} to ViewPoint -> {1, 0, 0}, ViewProjection -> "Orthographic"
plot3 = ParametricPlot3D[{{Cos[t], Sin[t], t/2}, {Cos[t + Pi], 
    Sin[t + Pi], t/2}, 
   If[EvenQ[Floor[4 t/Pi]], {Cos[t], Sin[t], t/2}, {Cos[t + Pi], 
     Sin[t + Pi], t/2}]}, {t, 0, 4 Pi}, PlotStyle -> Black, 
  Boxed -> False, ViewPoint -> {1, 0, 0}, 
  ViewProjection -> "Orthographic", ViewVertical -> {0, -1, 0}, 
  Axes -> False]
plot2 = Graphics[plot3[[1]] /. {x_Real, y_Real, z_Real} :> {z, y}]
Export["test.pdf", plot2]
SystemOpen["test.pdf"]

enter image description here

$\endgroup$
3
  • $\begingroup$ Fascinating approach! Just out of curiosity, in your other answer, PlotPoints does define "smoothness", to some extent, right? $\endgroup$
    – sam wolfe
    Commented Jun 1, 2023 at 13:45
  • $\begingroup$ @samwolfe Yes,` PlotPoints -> 80, MaxRecursion -> 4` make the curve smooth. $\endgroup$
    – cvgmt
    Commented Jun 1, 2023 at 13:48
  • $\begingroup$ Great. This is more than enough, naturally, but I wonder if there is a systematic way to incorporate the analytical projected curves within Mathematica (for monochrome line figures, at least) so that we could plot the actual 2D curves from mathematical expressions. Perhaps I could write a question focussing on that alone. Either way, great answer! Thanks! $\endgroup$
    – sam wolfe
    Commented Jun 1, 2023 at 14:06
1
$\begingroup$

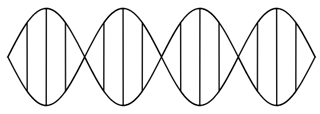
Not really an answer, but a solution to my particular problem:

helix1[t_] := {Sin[t], t/2}
helix2[t_] := {Sin[t + Pi], t/2}
connectingLine[t_] := 
 If[EvenQ[Floor[4 t/Pi]], {Sin[t], t/2}, {Sin[t + Pi], t/2}]
img = Rotate[
  ParametricPlot[{helix1[t], helix2[t], connectingLine[t]}, {t, 0, 
    4 Pi}, PlotStyle -> Black, Axes -> False], Pi/2]
Export["img.pdf", img]
enter image description here

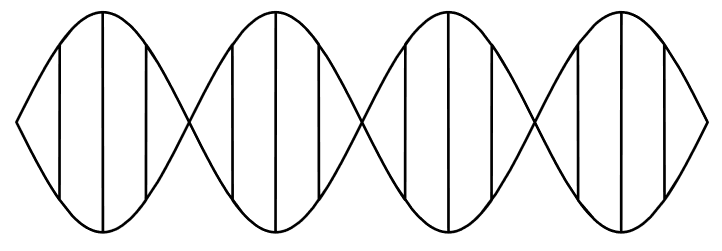
This produces a Graphics object which I can easily export as a vector, without the antialiasing issue.

The general question is somewhat trickier, as it has to do with how Mathematica handles the export of Graphics3D objects. Ultimately, my "solution" is merely analytical, where a projection onto a 2D plane is relatively easy, given the ViewPoint setting in the original ParametricPlot3D. This has already been partially discussed before in this question, and it would be interesting to know whether there is a reasonably general way of guaranteeing lossless vectorized images from 2D representations of 3D plots.

I am not too familiar with vector graphics rendering, but it would be interesting to know whether this has been discussed before within Mathematica. In particular, whether ViewPoint settings alone could be used to directly infer the 2D projection, rather than merely using standard vectorizing techniques, where information would be lose.

$\endgroup$

Your Answer

By clicking “Post Your Answer”, you agree to our terms of service and acknowledge you have read our privacy policy.

Not the answer you're looking for? Browse other questions tagged or ask your own question.