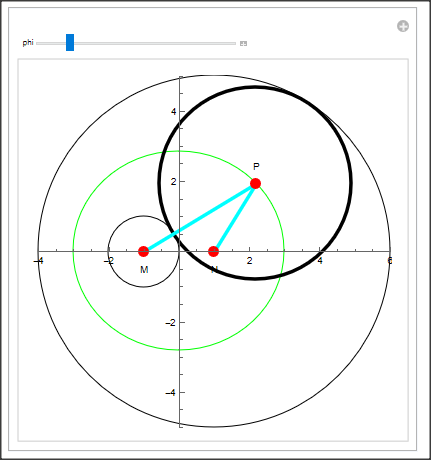
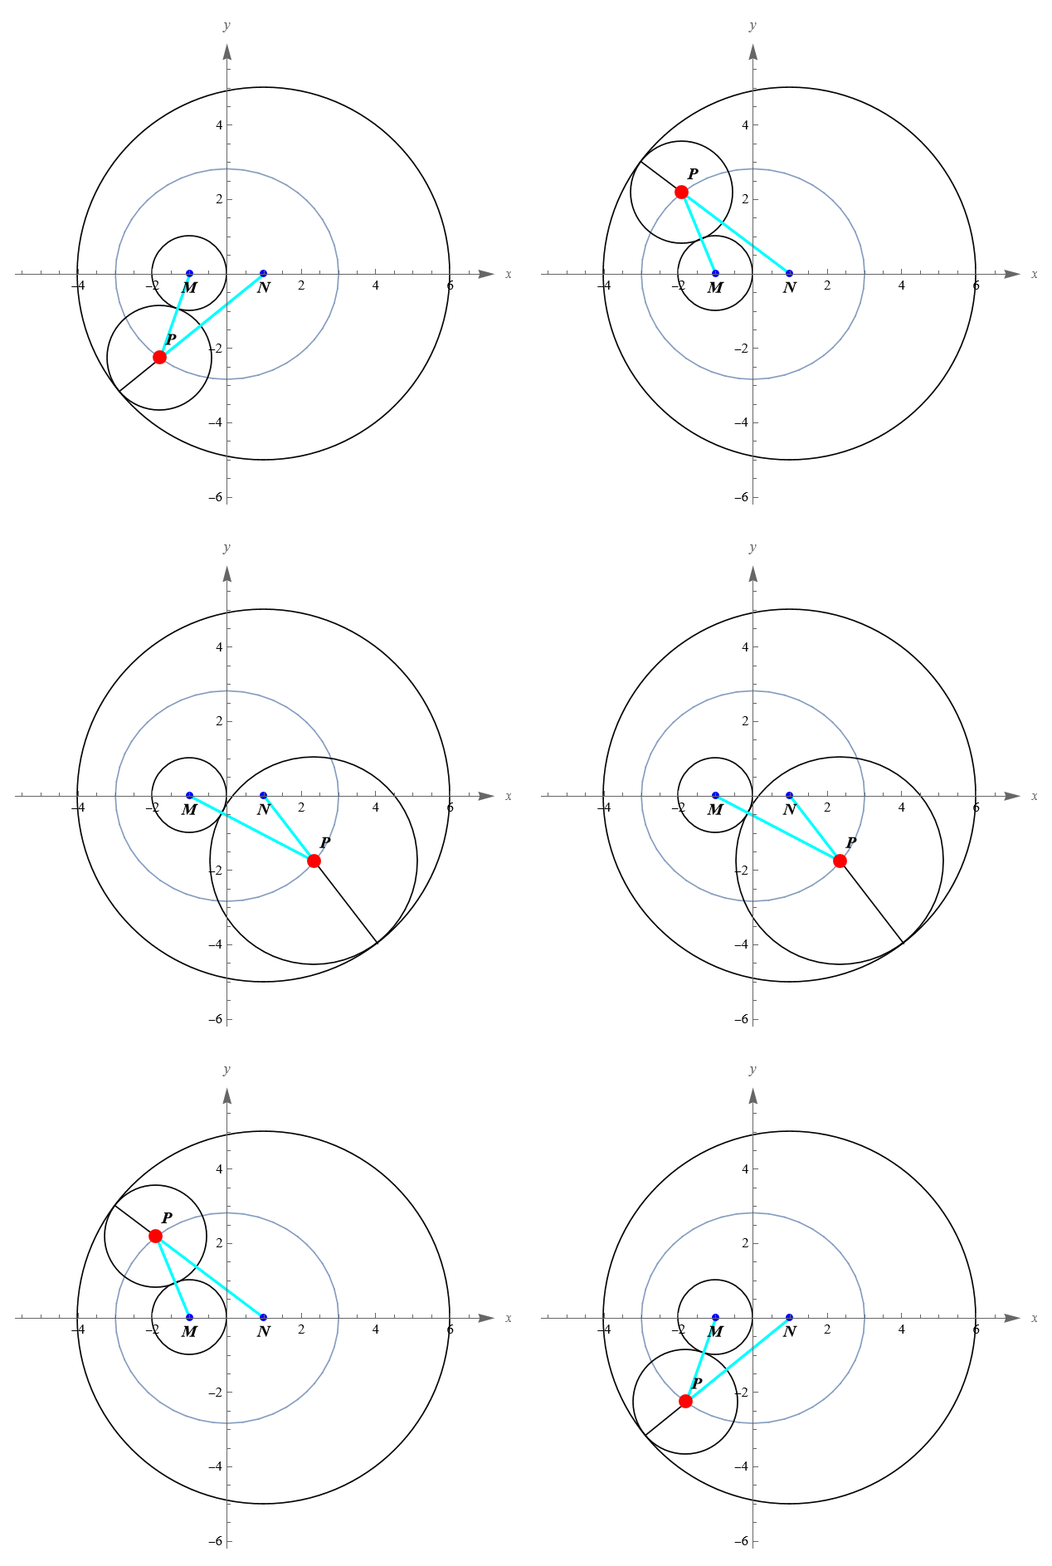
It is known that circle M: (x+1) ^ 2+y ^ 2=1, circle N: (x-1) ^ 2+y ^ 2=25, dynamic circle P is circumscribed by circle M and inscribed by circle N, and the locus of circle center P is curve C. It is required to draw two fixed circles M and N, and show the track of the center P in the form of a dynamic graph, that is, show the track of P as an ellipse in the form of a moving point P.
M circle and N circle are fixed circle, that is, the center and radius of the circle are known. So M circle and N circle are fixed. The center of the circle P is point P, (the picture I sent has been noted above).dynamic circle P is circumscribed by circle M and inscribed by circle N, and the locus of circle center P is curve C.The motion path of the center P of circle P is an ellipse C. I want to express the elliptical trajectory in the form of dynamic graph.
Just as the moon revolves around the earth, the trajectory of the moon is drawn with an ellipse, and the moon is represented by a point, which moves around and around on its trajectory. Want to achieve the same effect
Thank you cvgmt very much for the code provided here. This code needs to use the mouse to point P and then drag to the moving point P and the moving circle to move according to the ellipse track. I want to click the autorun button and move the point P and circle automatically. thank you!
How to draw the dynamic diagram of the required moving point trajectory?
This is the code provided by cvgmt. Thank you very much!
Clear["Global`*"];
n = {1, 0};
m = {-1, 0};
rN = 5;
rM = 1;
circleM = Circle[m, rM];
circleN = Circle[n, rN];
reg = ImplicitRegion[
   EuclideanDistance[{x, y}, m] - rM ==
    rN - EuclideanDistance[{x, y}, n], {x, y}];
p0 = {x, y} /. FindInstance[{x, y} ∈ reg, {x, y}][[1]];
Manipulate[
 Module[{circleP}, circleP = Circle[p, EuclideanDistance[p, m] - rM];
  Show[Region[reg],
   Graphics[{circleM, circleN, circleP,
     Line[{n,
       n + (EuclideanDistance[p, n] + EuclideanDistance[p, m] -
           rM) Normalize[p - n]}], {AbsoluteThickness[2], Cyan,
      Line[{m, p}], Line[{n, p}]},
     AbsolutePointSize[5], {Blue, Point[m],
      Point[n]}, {AbsolutePointSize[10], Red, Point[p]},
     Text[Style["P", Bold, Italic, 12, FontFamily -> "Times"],
      p, {-2, -2}],
     Text[Style["M", Bold, Italic, 12, FontFamily -> "Times"],
      m, {0, 1.5}],
     Text[Style["N", Bold, Italic, 12, FontFamily -> "Times"],
      n, {0, 1.5}]}], Axes -> True,
   AxesStyle -> Arrowheads[{{.035, 1.0}}],
   PlotRange -> {{-4.5, 6}, Automatic}, PlotRangePadding -> 1.2,
   AxesLabel -> {x, y},
   LabelStyle -> Directive[FontFamily -> "Times", 10]]], {{p, p0},
  Locator,
  TrackingFunction -> Function[pos, p = RegionNearest[reg]@pos],
  Appearance -> None}]
ask a new question since it need to write another code,I want to click the autorun button and move the point P and circle automatically. thank you!
Update 1:
Clear["Global`*"];
n = {4, 0};
m = {-4, 0};
rN = 13;
rM = 3;
circleM = Circle[m, rM];
circleN = Circle[n, rN];
rx = (rN + rM)/2;
ry = Sqrt[((rN + rM)/2)^2 - (Norm[(n - m)]/2)^2];
getP[phi_] := Module[{a, p}, p = n + a {Cos[phi], Sin[phi]};
  {p, rN - a} /. Solve[Norm[p - m] - rM == rN - a, a][[1]]]
Manipulate[
 Graphics[{circleM, circleN, {p, rad} = getP[phi];
   Print[{p, rad}] // N;
   {Green, Circle[(m + n)/2, {rx, ry}]}, Thickness[0.01],
   Circle[p, rad], Cyan, Thickness[0.01], Line[{{p, m}, {p, n}}], Red,
    PointSize[0.03], Point[{p, m, n}], Black, Text["M", m - {0, 0.5}],
    Text["N", n - {0, 0.5}], Text["P", p + {0, 0.5}]},
  AxesStyle -> Arrowheads[{{.035, 1.0}}],
  PlotRange -> {{-10, 20}, {-15, 15}}, Axes -> True], {{phi, Pi/2}, 0,
   2 Pi}]


