3
$\begingroup$

I want to plot my functions, but I can't seem to figure out what's going wrong. I want to be able to animate it as well.

N0 = 4; μ = 2; ϵ = 5
crazy = Flatten[
Join[
Table[x[i, j]''[t] == ϵ*(1 - x[i, j][t]^2)*x[i, j]'[t] - 
  x[i, j][t] + μ*(x[i + 1, j][t] + x[i, j + 1][t] - 
     4*x[i, j][t] + x[i - 1, j][t] + x[i, j - 1][t]), {i, 1, 
 N0 - 1}, {j, 1, N0 - 1}],

{Table[
 x[i, 0]''[t] == -x[i, 0][t] + ϵ*(1 - x[i, 0][t]^2)*
    x[i, 0]'[
     t] + μ*(x[i, 1][t] + x[i + 1, 0][t] - 4*x[i, 0][t] + 
      x[i - 1, 0][t] + x[i, N0][t]), {i, 1, N0 - 1}],

Table[
 x[i, N0]''[t] == ϵ*(1 - x[i, N0][t]^2)*x[i, N0]'[t] - 
   x[i, N0][
    t] + μ*(x[i + 1, N0][t] + x[i, 0][t] - 4*x[i, N0][t] + 
      x[i - 1, N0][t] + x[i, N0 - 1][t]), {i, 1, N0 - 1}],

Table[
 x[0, j]''[t] == ϵ*(1 - x[0, j][t]^2)*x[0, j]'[t] - 
   x[0, j][t] + μ*(x[1, j][t] + x[0, j + 1][t] - 
      4*x[0, j][t] + x[N0, j][t] + x[0, j - 1][t]), {j, 1, 
  N0 - 1}],

Table[
 x[N0, j]''[t] == ϵ*(1 - x[N0, j][t]^2)*x[N0, j]'[t] - 
   x[N0, j][
    t] + μ*(x[0, j][t] + x[N0, j + 1][t] - 4*x[N0, j][t] + 
      x[N0 - 1, j][t] + x[N0, j - 1][t]), {j, 1, N0 - 1}],

x[0, 0]''[t] == ϵ*(1 - x[0, 0][t]^2)*x[0, 0]'[t] - 
  x[0, 0][t] + μ*(x[1, 0][t] + x[0, 1][t] - 4*x[0, 0][t] + 
     x[N0, 0][t] + x[0, N0][t]),

x[N0, 0]''[t] == ϵ*(1 - x[N0, 0][t]^2)*x[N0, 0]'[t] - 
  x[N0, 0][
   t] + μ*(x[0, 0][t] + x[N0, 1][t] - 4*x[N0, 0][t] + 
     x[N0 - 1, 0][t] + x[N0, N0][t]),

x[0, N0]''[t] == ϵ*(1 - x[0, N0][t]^2)*x[0, N0]'[t] - 
  x[0, N0][
   t] + μ*(x[1, N0][t] + x[0, 0][t] - 4*x[0, N0][t] + 
     x[N0, N0][t] + x[0, N0 - 1][t]),

x[N0, N0]''[t] == ϵ*(1 - x[N0, N0][t]^2)*x[N0, N0]'[t] - 
  x[N0, N0][
   t] + \[Mu]*(x[0, N0][t] + x[N0, 0][t] - 4*x[N0, N0][t] + 
     x[N0 - 1, N0][t] + x[N0, N0 - 1][t]),


    x[0, 0][0] == 1, x[0, 0]'[0] == .5, x[N0/2, N0/2][0] == 0, 
x[N0/2, N0/2]'[0] == 0},
Table[x[i, j]'[0] == 0, {i, 1, N0/2 - 1}, {j, 0, N0}], 
Table[x[i, j][0] == 0, {i, 1, N0/2 - 1}, {j, 0, N0}],
Table[x[i, j]'[0] == 0, {i, N0/2 + 1, N0}, {j, 0, N0}], 
Table[x[i, j][0] == 0, {i, N0/2 + 1, N0}, {j, 0, N0}],
Table[x[N0/2, j]'[0] == 0, {j, 0, N0/2 - 1}], 
Table[x[N0/2, j][0] == 0, {j, 0, N0/2 - 1}],
Table[x[N0/2, j]'[0] == 0, {j, N0/2 + 1, N0}], 
Table[x[N0/2, j][0] == 0, {j, N0/2 + 1, N0}],
Table[x[0, j][0] == 0, {j, 1, N0}], 
Table[x[0, j]'[0] == 0, {j, 1, N0}]]];


moo = NDSolve[crazy, Table[x[i, j], {i, 0, N0}, {j, 0, N0}], {t, 100}]


points = Table[{i, j, x[i, j][t]} /. moo, {i, 0, N0}, {j, 0, 
N0}]

Animate[ListPointPlot3D[points], {t, 0, 100
}, AnimationRate -> 2, AnimationRepetitions -> 2, 
AnimationRunning -> False]
$\endgroup$
8
  • $\begingroup$ You'll want to start by fixing the syntax errors in your code. $\endgroup$ Commented Jun 27, 2013 at 16:34
  • $\begingroup$ @CoreyKelly I don't know how. Hence, my problem. $\endgroup$
    – Slightly
    Commented Jun 27, 2013 at 16:38
  • $\begingroup$ Have you read the error messages? They state the problem quite clearly. $\endgroup$ Commented Jun 27, 2013 at 16:39
  • $\begingroup$ @CoreyKelly Fixed $\endgroup$
    – Slightly
    Commented Jun 27, 2013 at 16:41
  • $\begingroup$ The next problem is that you're trying to plot a function x[i,j] that you haven't defined anywhere. $\endgroup$ Commented Jun 27, 2013 at 16:44

1 Answer 1

5
$\begingroup$

To make it work, you first have to flatten the two-dimensional tables in your variable lists. Then since Animate holds its arguments unevaluated, one has to inject the instantaneous value of t into the InterpolationFunctions in some way. One solution is to use a replacement rule with a different variable name t0 as the time counter for Animate:

moo = NDSolve[
   crazy,
   Flatten@Table[x[i, j], {i, 0, N0}, {j, 0, N0}], {t, 100}];

points = Flatten[
   Table[{i, j, x[i, j][t]} /. moo, {i, 0, N0}, {j, 0, N0}], 2];


Animate[
 ListPointPlot3D[points /. t -> t0, 
  PlotRange -> {{0, 4}, {0, 4}, {-10, 10}}], {t0, 0, 100}, 
 AnimationRate -> 2, AnimationRepetitions -> 2, 
 AnimationRunning -> False]
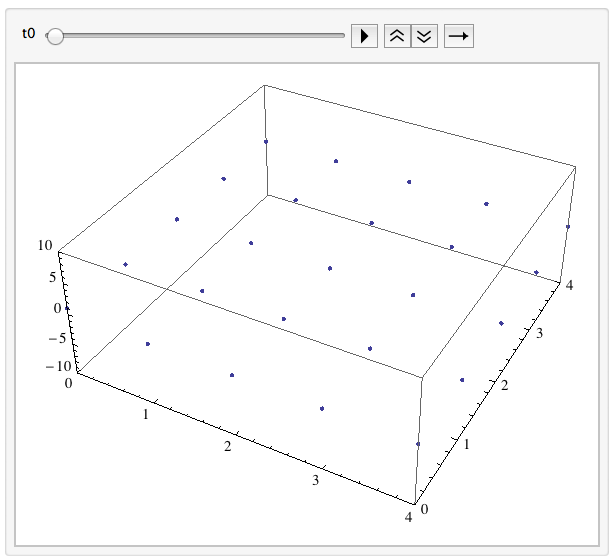
animate

Here, I also set a fixed PlotRange as this makes the movement of the points clearer in the animation.

$\endgroup$
4
  • $\begingroup$ Thank you a lot, I need to get myself more adjusted with the flatten command. Also, why the 2 in "moo"? How would we connect the dots? $\endgroup$
    – Slightly
    Commented Jun 27, 2013 at 19:08
  • $\begingroup$ Why the 2 in points (not in moo): it's a level specification that tells Flatten to collect levels 1 and 2 into a single list, while leaving the three-element lists at level 3 (i.e., the individual points) in the form of lists. Without level specification, Flatten would have turned the lists of coordinate triplets into a string of individual numbers, unsuitable for the 3D plot. The Flatten in moo doesn't need the specification because I want only a single-level list of function variables. $\endgroup$
    – Jens
    Commented Jun 27, 2013 at 19:55
  • $\begingroup$ Is there any way to connect the dots? I couldn't find anything in the options menu. $\endgroup$
    – Slightly
    Commented Jun 27, 2013 at 20:01
  • $\begingroup$ To find a representation you like, you could look into ListPlot3D and its options for Mesh and InterpolationOrder. $\endgroup$
    – Jens
    Commented Jun 27, 2013 at 20:21

Your Answer

By clicking “Post Your Answer”, you agree to our terms of service and acknowledge you have read our privacy policy.

Not the answer you're looking for? Browse other questions tagged or ask your own question.