I would like to know if it is possible to carry out a rotation involving the x and y axis (the gridline too) cause I know how to do it with a vector and an arrow but not with the axis.
1 Answer
$\begingroup$
$\endgroup$
2
Here are two ways to get rotated axes:
Using the fifth argument of
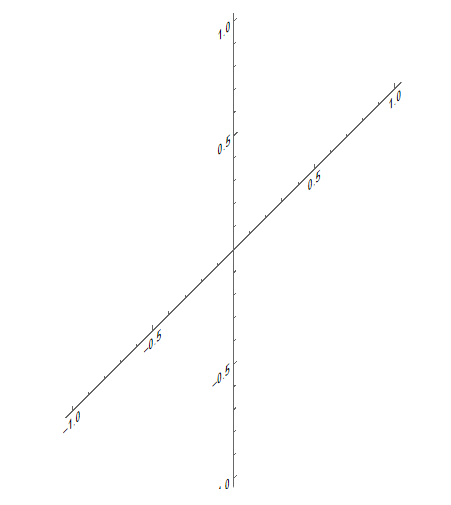
Inset:Graphics[ Inset[Graphics[{}, Axes -> True], {0, 0}, {0, 0}, {2, 2}, {{1, 1}, {0, 1}}], PlotRange -> 1 ]This will shear everything inside the inner
Graphicsexpression. As you can see, even the labels of the axes are sheared.Using
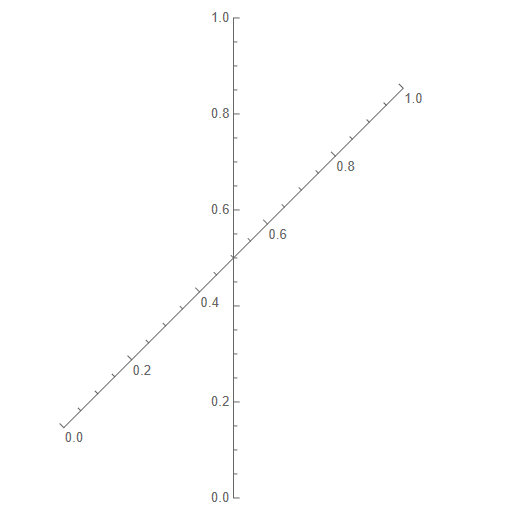
AxisObject(new in 12.3):Graphics[ {AxisObject[Line@{{-1, -1}/Sqrt[2], {1, 1}/Sqrt[2]}], AxisObject[Line@{{0, -1}, {0, 1}}]}, PlotRange -> 1 ]Here, you can directly specify from where to where the axes should point. Only the direction of the axes is affected. As you can see, labels of the axes are not affected.
-
$\begingroup$ Thank you, your comment has been very useful to me. Just one more thing, is this possible tu with manipulate so you can rotate the axis like that??? $\endgroup$ Commented Dec 4, 2022 at 17:59
-
$\begingroup$ With the
AxisObjectapproach, you should be able to add interactivity just as if you had a normal line, e.g.Manipulate[Graphics[{AxisObject[Line@{{0, 0}, Dynamic@p}]}, PlotRange -> 1], {{p, {1, 1}}, Locator}]$\endgroup$ Commented Dec 4, 2022 at 21:37


Rotate[Plot[x^2, {x, -2, 2}], 45 Degree]$\endgroup$Plot[x^2, {x, -2, 2}] // Image // ImageRotate[#, 45 Degree] &$\endgroup$Plot[x^2, {x, -2, 2}] //Cases[#,_Line,All] &$\endgroup$ImageGraphics$\endgroup$