4
$\begingroup$

I use an external software (Amira) to segment X-ray tomography images and then create a surface mesh which I can then import into Mathematica as an STL file. This file has two enclosed regions, separated by a common boundary. I would like to be able to assign different material properties to the two regions for mechanical finite element simulations. How can this be done efficiently?

I guess as long as I know the coordinates of a point that lies within each region then I should be able to define region markers that could help me here.

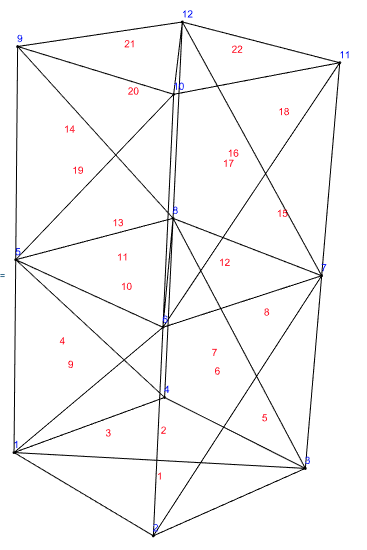
As a minimum working example I have created the following mesh, which consists of a rectangular prism of dimensions 1 x 1 x 2, which is separated into 2 cubic regions of equal size (1x 1x 1).

Needs["NDSolve`FEM`"]
bmesh = ToBoundaryMesh["Coordinates" -> {{0.0, 0.0, 0.0}, {1.0, 0.0, 0.0}, {1.0, 1.0, 0.0}, {0.0, 1.0, 0.0}, {0.0, 0.0, 1.0}, {1.0, 0.0, 1.0}, {1.0, 1.0, 1.0}, {0.0, 1.0, 1.0}, {0.0, 0.0, 2.0}, {1.0, 0.0,2.0}, {1.0, 1.0, 2.0}, {0.0, 1.0, 2.0}},"BoundaryElements" -> {TriangleElement[{{1, 3, 2}, {1, 3, 4}, {1, 2, 6}, {1, 6, 5}, {2, 3, 7}, {2, 7, 6}, {3, 4, 8}, {3, 8, 7}, {4,1, 5}, {4, 5, 8}, {8, 5, 6}, {8, 6, 7}, {5, 6, 10}, {5, 10, 9}, {6, 7, 11}, {6, 11, 10}, {7, 8, 12}, {7, 12, 11}, {8, 5,9}, {8, 9, 12}, {12, 9, 10}, {12, 10, 11}}, {1, 2, 3, 4, 5, 6, 7, 8, 9, 10, 11, 12, 13, 14, 15, 16, 17, 18, 19, 20, 21, 22}]}]
Show[bmesh["Wireframe"], bmesh["Wireframe"[ "MeshElement" -> "PointElements", "MeshElementIDStyle" -> Blue]],  bmesh["Wireframe"["MeshElementIDStyle" -> Red]]]

Mesh

Following the documentation for ToElementMesh I naively thought that we could just add region markers.

mesh = ToElementMesh[bmesh, "RegionMarker" -> {{{0.5, 0.5, 0.5}, 10}, {{0.5, 0.5, 1.5}, 20}},  MaxCellMeasure -> 0.1]
mesh["Wireframe"[
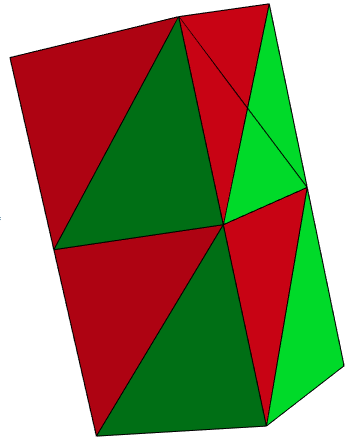
"MeshElementStyle" -> {Directive[FaceForm[Green]],Directive[FaceForm[Red]]}]]

meshedwithregions

Any hint as to what I am doing wrong here?

$\endgroup$
5
  • $\begingroup$ The definition of bmesh contains a triangelelement of all points TriangleElement[{1, 2, 3, 4, 5, 6, 7, 8, 9, 10, 11, 12, 13, 14, 15, 16, 17, 18, 19, 20, 21, 22}], is this intended? $\endgroup$ Commented Jul 4, 2022 at 8:05
  • $\begingroup$ @UlrichNeumann, it contains a list of markers; what you quote is not complete. $\endgroup$
    – user21
    Commented Jul 4, 2022 at 10:53
  • $\begingroup$ @user21 Thanks. I only took the last element of TriangleElement[{...,{1, 2, 3, 4, 5, 6, 7, 8, 9, 10, 11, 12, 13, 14, 15, 16, 17, 18, 19, 20, 21, 22}}] $\endgroup$ Commented Jul 4, 2022 at 11:09
  • $\begingroup$ @UlrichNeumann, please look again, the syntax is different from what you claim it to be. $\endgroup$
    – user21
    Commented Jul 4, 2022 at 11:22
  • $\begingroup$ @user21 I got it, thanks. $\endgroup$ Commented Jul 4, 2022 at 11:33

1 Answer 1

4
$\begingroup$

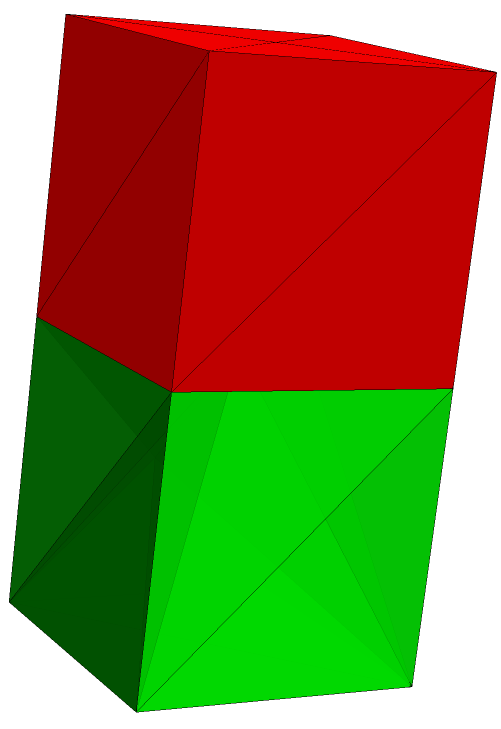
You are looking at the boundary elements; you'd need to look at the mesh elements.

mesh = ToElementMesh[bmesh, 
  "RegionMarker" -> {{{0.5, 0.5, 0.5}, 10}, {{0.5, 0.5, 1.5}, 20}}, 
  MaxCellMeasure -> 0.1]
mesh["MeshElementMarkerUnion"]
(* {10, 20} *)

mesh["Wireframe"["MeshElement" -> "MeshElements", 
  "MeshElementStyle" -> {Directive[Opacity[0.75], FaceForm[Green]], 
    Directive[FaceForm[Red]]}]]

enter image description here

$\endgroup$
7
  • $\begingroup$ Ah, Thanks! Should this question be closed as it seems like this is a mistake related to me using the wrong commands for mesh visualisation? $\endgroup$
    – Dunlop
    Commented Jul 4, 2022 at 10:40
  • $\begingroup$ @Dunlop, I'd leave that up to you. What would be useful for me to know, is how I could improve the documentation in such a way that you would have prevented this misunderstanding. If you have a suggestion, let me know. $\endgroup$
    – user21
    Commented Jul 4, 2022 at 10:51
  • $\begingroup$ Ok, I will go again to the documentation and see what would have helped me here. I have to say the extended documentation on FE is really good and I am learning a lot. $\endgroup$
    – Dunlop
    Commented Jul 4, 2022 at 12:20
  • $\begingroup$ To be honest it was in the documentation stating that boundary meshes are visualized in 3D. I guess what I wasn't sure about doing was working out whether the region assignment for the meshes had worked or not, and that got me confused with the visualisation. What could help for the future is something in the documentation that gives a 3D example of meshes where regions with different properties can be created. $\endgroup$
    – Dunlop
    Commented Jul 4, 2022 at 18:10
  • 1
    $\begingroup$ @Dunlop, in 3D basically use/look at OpenCascade when you can not get a decent solution otherwise. $\endgroup$
    – user21
    Commented Jul 6, 2022 at 4:56

Your Answer

By clicking “Post Your Answer”, you agree to our terms of service and acknowledge you have read our privacy policy.

Not the answer you're looking for? Browse other questions tagged or ask your own question.