1
$\begingroup$

I'm trying to create a disk with a radial gradient. I found the built in function "RadialGradientFilling" which should do the trick but, alas, I am using an older version of Mathematica where it is not supported. Is there any work around to be able to do something along the lines of

Graphics[{RadialGradientFilling[{Red, Blue}], Disk[]}]

in Mathematica 11.1? I know its possible to make a grid of points with some color distribution but I really need it to be applied to a Disk graphic. Any thoughts?

The actual code I'm working on can be found down below. I'm trying to give the gradient color to the yellow Graphic

Manipulate[
 Module[{npoints = 2000, munit = 10^11, plotsize = 10, 
   sec2rad = Pi/(180. 3600.), sxy}, 
  imagePos[sourcexy_, mass_, distlens_] := 
   Module[{g = 6.6726*10^-11(*m^3/(kg s^2)*), c = 2.99792458*10^8(*m/
     s*), msun = 1.989*10^30(*kg*), parsec = 3.0856*10^16(*m*), 
     ly = 3.26(*parsec*), ds, dl, b, bx, by, u, t1, t2, image1, 
     image2, images},
    b = Sqrt[Total[sourcexy^2]];
    If[b > 10^-10,
     ds = 1 parsec 10^9;
     dl = (distlens parsec 10^9)/ly;
     u = 4 msun Abs[ds - dl]/(ds dl) (g  mass)/c^2;
     t1 = (1 + Sqrt[1 + (4 u)/b^2])/2;
     t2 = (1 - Sqrt[1 + (4 u)/b^2])/2,
     t1 = 0;
     t2 = 0];
    image1 = t1 sourcexy;
    image2 = t2 sourcexy;
    images = Join[List[image1], List[image2]];
    Return[images]];
  source[center_, r_, npoints_] := Module[{p, x, y, points},
    p = Table[(2 Pi)/npoints i, {i, 0, npoints}];
    x = List[center[[1]] + List[r Cos[p]]];
    y = List[center[[2]] + List[r Sin[p]]];
    points = MapThread[List, Flatten[List[x, y], 2]];
    Return[points]];
  If[Sqrt[sourcexy[[1]]^2 + sourcexy[[2]]^2] > 10^-4, sxy = sourcexy, 
   sxy = {0, 0}];
   If[Sqrt[sxy[[1]]^2 + sxy[[2]]^2] > r,
   Graphics[
    {{Yellow, 
      Polygon[Part[
        Flatten[1/
          sec2rad (imagePos[#, munit mass, dl] & /@ 
            source[sec2rad sxy, sec2rad r, npoints]), 1], 
        Table[i, {i, 1, 2 npoints - 1, 2}]]]}, {Yellow, 
      Polygon[Part[
        Flatten[1/
          sec2rad (imagePos[#, munit mass, dl] & /@ 
            source[sec2rad sxy, sec2rad r, npoints]), 1], 
        Table[i, {i, 2, 2 npoints, 2}]]]}, {Gray, 
      Disk[{0, 0}, plotsize/30]}, 
     Text["source-lens separation (arcsec):" PaddedForm[Sqrt[
        sxy[[1]]^2 + sxy[[2]]^2], {4, 2}], {-.06 plotsize, 
       5/6 plotsize + .5}]}, PlotRange -> plotsize, Frame -> True, 
    ImageSize -> {400, 400}],
   Graphics[{{Yellow, 
      Polygon[Part[
        Flatten[1/
          sec2rad (imagePos[#, munit mass, dl] & /@ 
            source[sec2rad sxy, sec2rad r, npoints]), 1], 
        Table[i, {i, 1, 2 npoints - 1, 2}]]]}, {White, 
      Polygon[Part[
        Flatten[1/
          sec2rad (imagePos[#, munit mass, dl] & /@ 
            source[sec2rad sxy, sec2rad r, npoints]), 1], 
        Table[i, {i, 2, 2 npoints, 2}]]]}, {Gray, 
      Disk[{0, 0}, plotsize/30]}, 
     Text["source-lens separation (arcseconds):" PaddedForm[Sqrt[
        sxy[[1]]^2 + sxy[[2]]^2], {4, 2}], {-.06 plotsize, 
       5/6 plotsize + .5}]}, PlotRange -> plotsize, Frame -> True, 
    ImageSize -> {400, 400}]]],
 {{sourcexy, {0, 0}}, {-10, -10}, {10, 10}, Locator},
 "distance to lens in \!\(\*SuperscriptBox[\(10\), \(9\)]\) light \
years",
 {{dl, 1.5, ""}, 0.4, 3, Appearance -> "Labeled"},
 "radius of circular image in arcsec",
 {{r, 1, ""}, 0.1, 2, Appearance -> "Labeled"},
 "mass of lens in \!\(\*SuperscriptBox[\(10\), \(11\)]\) solar \
masses", 
 {{mass, 10, ""}, 0.1, 100, Appearance -> "Labeled"},
 TrackedSymbols :> {sourcexy, dl, r, mass}]
$\endgroup$
0

1 Answer 1

2
$\begingroup$

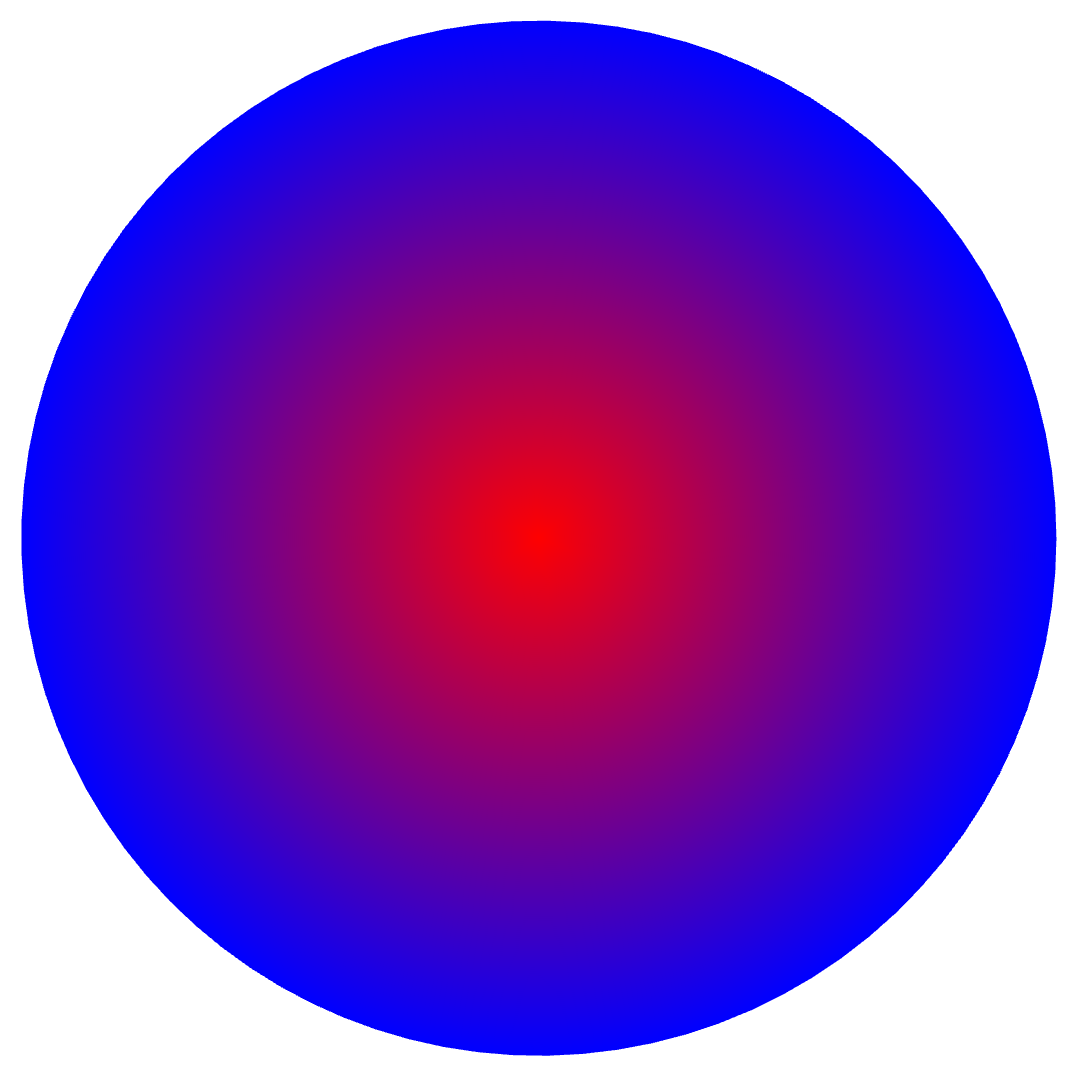
I don't know if the remark about a "grid of points" disqualifies this approach, but here's way to apply a gradient to a Disk[]:

reg = DiscretizeRegion[Disk[], MaxCellMeasure -> 0.002];
Graphics[
 GraphicsComplex[
  MeshCoordinates[reg],
  MeshCells[reg, 2],
  VertexColors ->
   (Blend[{Red, Blue}, Norm[#]] & /@ MeshCoordinates[reg])
  ]
 ]

enter image description here

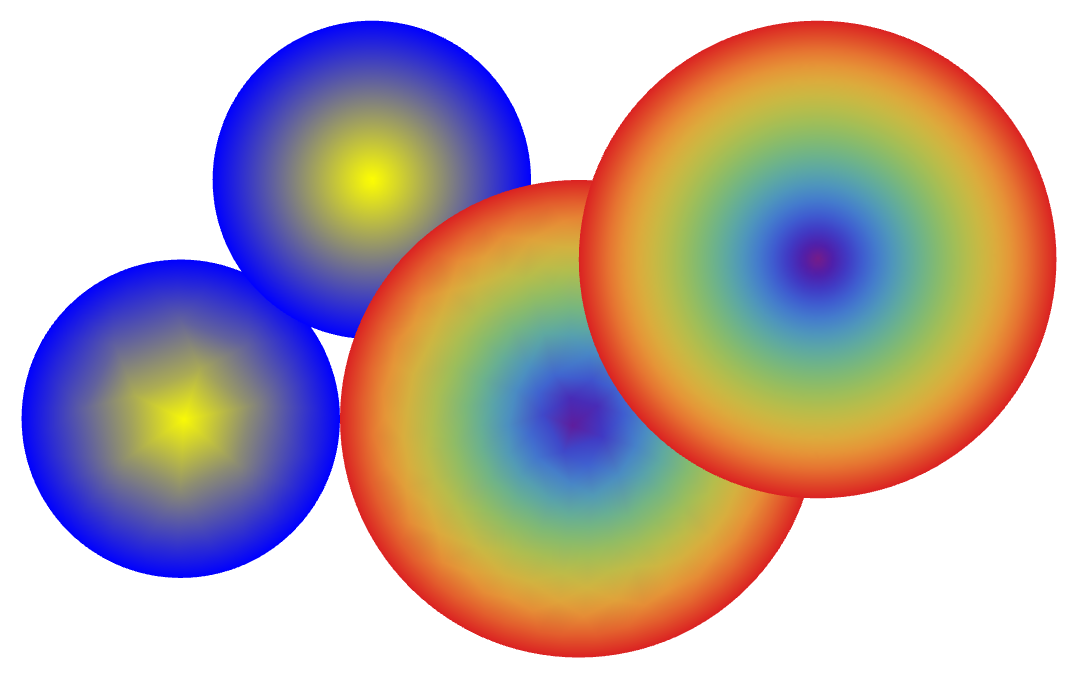
I'm not sure about the "yellow graphic" since the original post said and still says "disk", both of which are colored gray in the update. Here's a disk:

gradDisk // ClearAll;
gradDisk[ctr_, rad_, cf_, 
   meshOpts : OptionsPattern@DiscretizeRegion] := 
  With[{reg = DiscretizeRegion[
      ConvexHullMesh[
       Table[ctr + rad {Cos[t], Sin[t]},
        {t, Most@Subdivide[0., 2. Pi, 120]}]],
      meshOpts
      ]},
   GraphicsComplex[
    MeshCoordinates[reg],
    MeshCells[reg, 2],
    VertexColors -> (cf /@
     (EuclideanDistance[ctr, #]/rad & /@ MeshCoordinates[reg]))
    ]
   ];

Graphics[{
  gradDisk[{0, 0}, 1, Blend[{Yellow, Blue}, #] &, 
   MaxCellMeasure -> 0.1],
  gradDisk[{1.2, 1.5}, 1, Blend[{Yellow, Blue}, #] &, 
   MaxCellMeasure -> 0.001],
  gradDisk[{2.5, 0}, 1.5, ColorData@"Rainbow"],
  gradDisk[{4, 1}, 1.5, ColorData@"Rainbow", MaxCellMeasure -> 0.001]
  }]

enter image description here

$\endgroup$
5
  • $\begingroup$ This definitely looks good! I'm just trying to see how it can be applied to my specific scenario. I updated the question with the actual code I am working on. I'm trying to give the yellow graphic a gradient of some kind $\endgroup$ Commented Jun 2, 2022 at 23:17
  • $\begingroup$ @sorabella91 Do you want a Disk[] or a Polygon[] to have the gradient? How is a radial gradient defined for a polygon, by its circumcircle? Using reg = DiscretizeRegion[Polygon[..]] with {ctr, rad} = List @@ Circumsphere@Polygon[..] could be used in the above code. $\endgroup$
    – Michael E2
    Commented Jun 2, 2022 at 23:51
  • $\begingroup$ Sorry for the confusion. Yes I am trying to apply the gradient to the polygon graphic in the longer code. I was just using the disk as an example $\endgroup$ Commented Jun 3, 2022 at 0:51
  • $\begingroup$ So the polygon graphic is actually a disk that becomes distorted by a lensing effect. I imagined the gradient would distort with the image of the disk but perhaps that's too complicated... $\endgroup$ Commented Jun 3, 2022 at 1:14
  • $\begingroup$ @sorabella91 It's probably not too complicated — probably easy if the distortion is given as a function (formulas) from the disk to the distorted disk. But you need to ask for help on the problem you actually wanted solved, I think. — Here's an example of a distorted rectangle with a gradient: mathematica.stackexchange.com/a/69138/4999 $\endgroup$
    – Michael E2
    Commented Jun 3, 2022 at 4:30

Your Answer

By clicking “Post Your Answer”, you agree to our terms of service and acknowledge you have read our privacy policy.

Not the answer you're looking for? Browse other questions tagged or ask your own question.