I am very new to Mathematica and am struggling to get a plot for a differential equation I need solving. I am doing a simplified version of the lane-emden equation for n=1 so have the follwoing equation to be solved $$\frac{1}{x^2}\frac{d}{dx}\left(x^2\frac{df(x)}{dx}\right)+f(x)=f''(x)+2\frac{f'(x)}{x}+f(x)$$ Since it has a singularity at zero, I have using the following approximation for near the origin:
series[x_] := 1 + x^2(-1/6) +x^4(1/120)
So my equation I want to be able to plot is the following:
sol = f[x] /. NDSolve[{f[x] + 2f'[x]/x +f''[x] == 0, f[0.1] == series[0.1], f'[0.1] == series[0.1]}, f, {x, 0.1, 4}]
When I do:
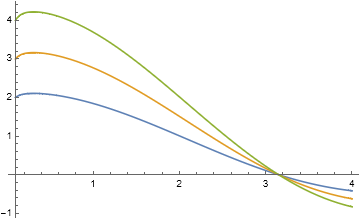
Plot[sol, {x, 0.1, 4}]
I just get an empty axis and no graph so I really don't know why it won't work or how to fix it. Any ideas?


:=to define functions likeseriesrather than=. 2) Your boundary conditions need to be expressed as equations, using==(Equal) and not=(Set). Make sure to runClearAll[f]before your fixed code. 3) You can't have a non-numerical symbolic value likex0when you seek a numerical solution to your equation. If the solution is parametric, then useParametricNDSolve; ifx0has a value, then please include it in your definitions. $\endgroup$